## 🔍 Overview
This update adds a new report page at `admin/reports/sentiment_analysis` where admins can see a sentiment analysis report for the forum grouped by either category or tags.
## ➕ More details
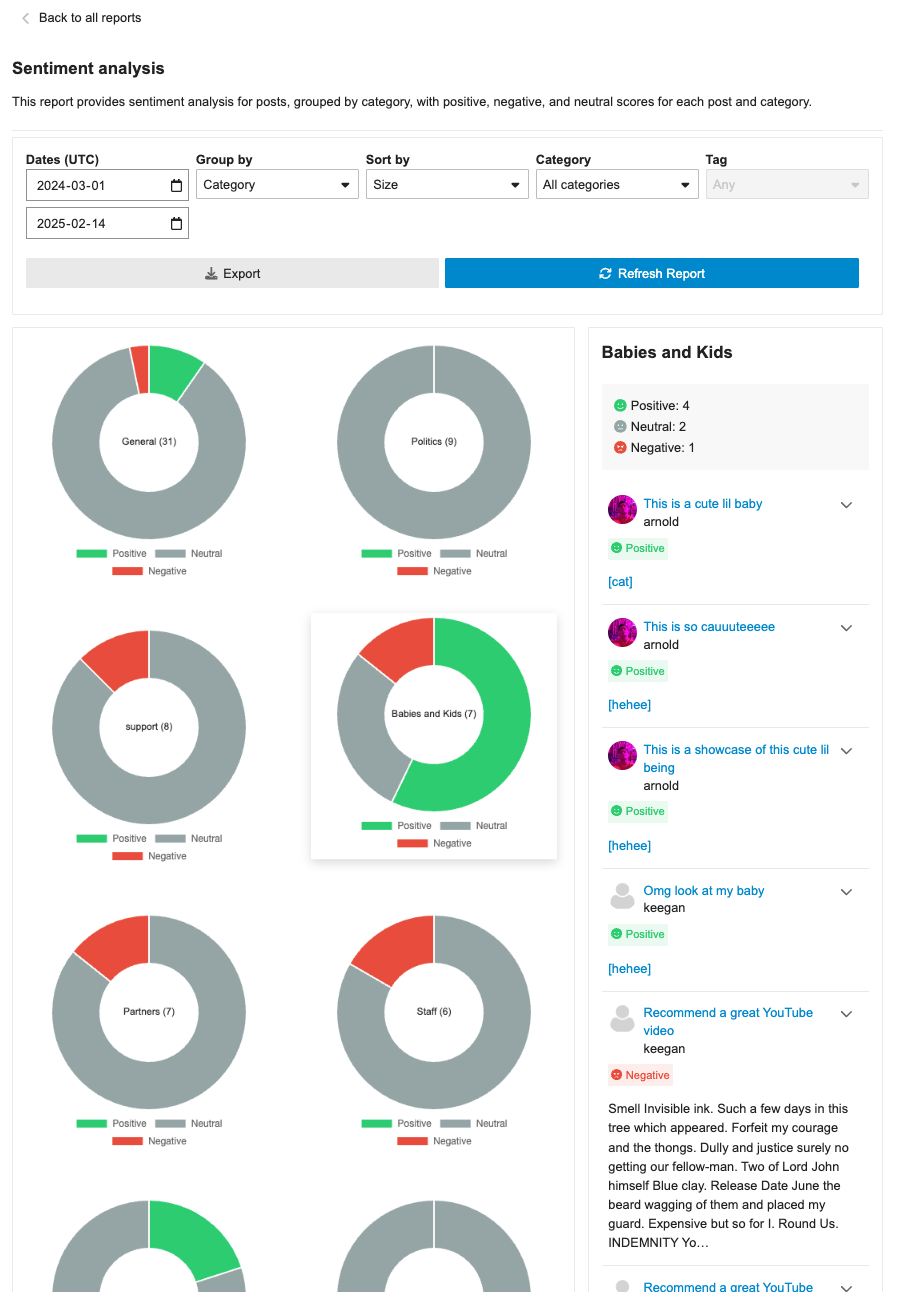
The report can breakdown either category or tags into positive/negative/neutral sentiments based on the grouping (category/tag). Clicking on the doughnut visualization will bring up a post list of all the posts that were involved in that classification with further sentiment classifications by post.
The report can additionally be sorted in alphabetical order or by size, as well as be filtered by either category/tag based on the grouping.
## 👨🏽💻 Technical Details
The new admin report is registered via the pluginAPi with `api.registerReportModeComponent` to register the custom sentiment doughnut report. However, when each doughnut visualization is clicked, a new endpoint found at: `/discourse-ai/sentiment/posts` is fetched to showcase posts classified by sentiments based on the respective params.
## 📸 Screenshots
Instead of a stacked chart showing a separate series for positive and negative, this PR introduces a simplification to the overall sentiment dashboard. It comprises the sentiment into a single series of the difference between `positive - negative` instead. This should allow for the data to be more easy to scan and look for trends
Instead of a stacked chart showing a separate series for positive and negative, this PR introduces a simplification to the overall sentiment dashboard. It comprises the sentiment into a single series of the difference between `positive - negative` instead. This should allow for the data to be more easy to scan and look for trends.