--- title: "Event-driven Image and BigQuery processing pipelines with Knative on Google Cloud" date: 2020-06-19 description: "Using Knative Eventing to build event-driven image and BigQuery processing pipelines on Google Cloud" type: "blog" --- In this blog post, I will outline two event-driven processing pipelines that I recently built with Knative Eventing. Along the way, I will explain event sources, custom events and other components provided by Knative, that greatly simplify the development of event-driven architectures. Both of these pipelines are available on GitHub, including source code, configurations, and detailed instructions, as part of my [Knative Tutorial](https://github.com/meteatamel/knative-tutorial). ## Knative components used When creating these example pipelines, I relied on a few Knative components that greatly simplified my development. More specifially: 1. [Event sources](https://knative.dev/docs/eventing/sources/) allow you to read external events in your cluster. [Knative-GCP Sources](https://github.com/google/knative-gcp#knative-gcp-sources) provide a number of eventing sources ready to read events from various Google Cloud sources. 2. [Broker and triggers](https://knative.dev/docs/eventing/broker/) provide event delivery without producers or consumers needing to know about how the events are routed. 3. **Custom events and event replies**: In Knative, all events are [CloudEvents](https://cloudevents.io/), so it's useful to have a standard format for events and various SDKs to read/write them. Knative supports custom events and event replies. Any service can receive an event, do some processing, create a custom event with new data, and reply back to the broker so that other services can read the custom event. This is useful in pipelines, where each service does a little bit of work and passes the message forward to the next service. ## Image Processing Pipeline In this image processing pipeline example, users upload an image to a storage bucket on Google Cloud, process the image with a number of different Knative services, and save the processed image to an output bucket. I defined two requirements for the pipeline: 1. Uploaded images are filtered before they are sent through the pipeline. For example, no adult themed or violent images are allowed. 2. The pipeline can contain any number of processing services that can be added or removed as needed. ### Architecture This section explains the architecture of the image processing pipeline. The pipeline is deployed to Google Kubernetes Engine (GKE) on Google Cloud. 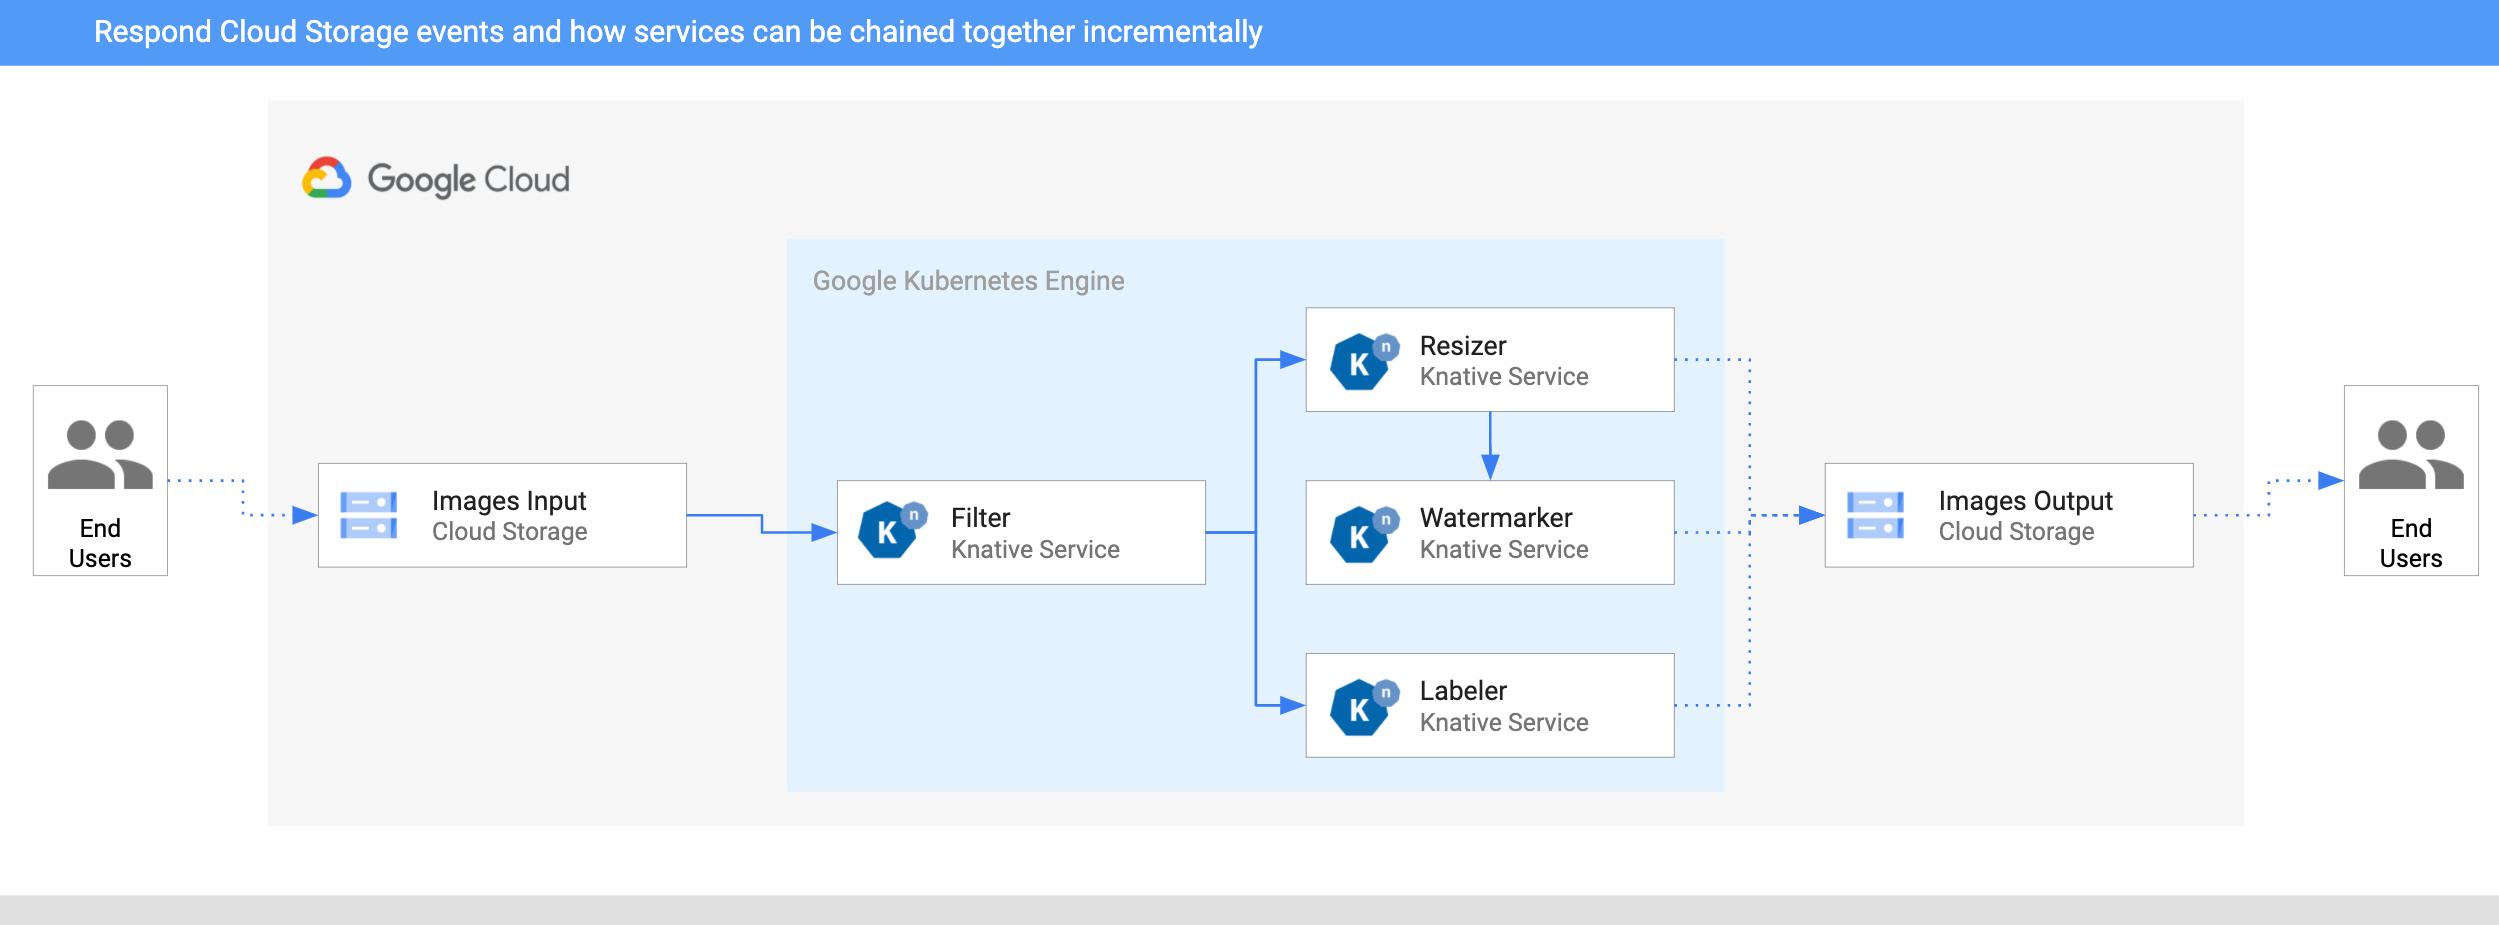 1. An image is saved to an input Cloud Storage bucket. 2. A Cloud Storage update event is read into Knative by [CloudStorageSource](https://github.com/google/knative-gcp/blob/master/docs/examples/cloudstoragesource/README.md). 3. A filter service receives the Cloud Storage event. It uses the Vision API to determine whether the image is safe or should be filtered. If the image is safe, the filter service creates a custom CloudEvent of type `dev.knative.samples.fileuploaded` and passes it back to the broker. 4. The resizer service receives the `fileuploaded` event, and then resizes the image using the [ImageSharp](https://github.com/SixLabors/ImageSharp) library. The service then saves the resized image to the output bucket, creates a custom CloudEvent of type `dev.knative.samples.fileresized`, and passes the event back to the broker. 5. The watermark service receives the `fileresized` event, adds a watermark to the image using the [ImageSharp](https://github.com/SixLabors/ImageSharp) library, and saves the image to the output bucket. 6. The labeler receives the `fileuploaded` event, extracts labels from the image using the Vision API, and saves the labels to the output bucket. ### Test the pipeline To test the pipeline, I uploaded a picture from my favorite beach, Ipanema in Rio de Janeiro, to the bucket: 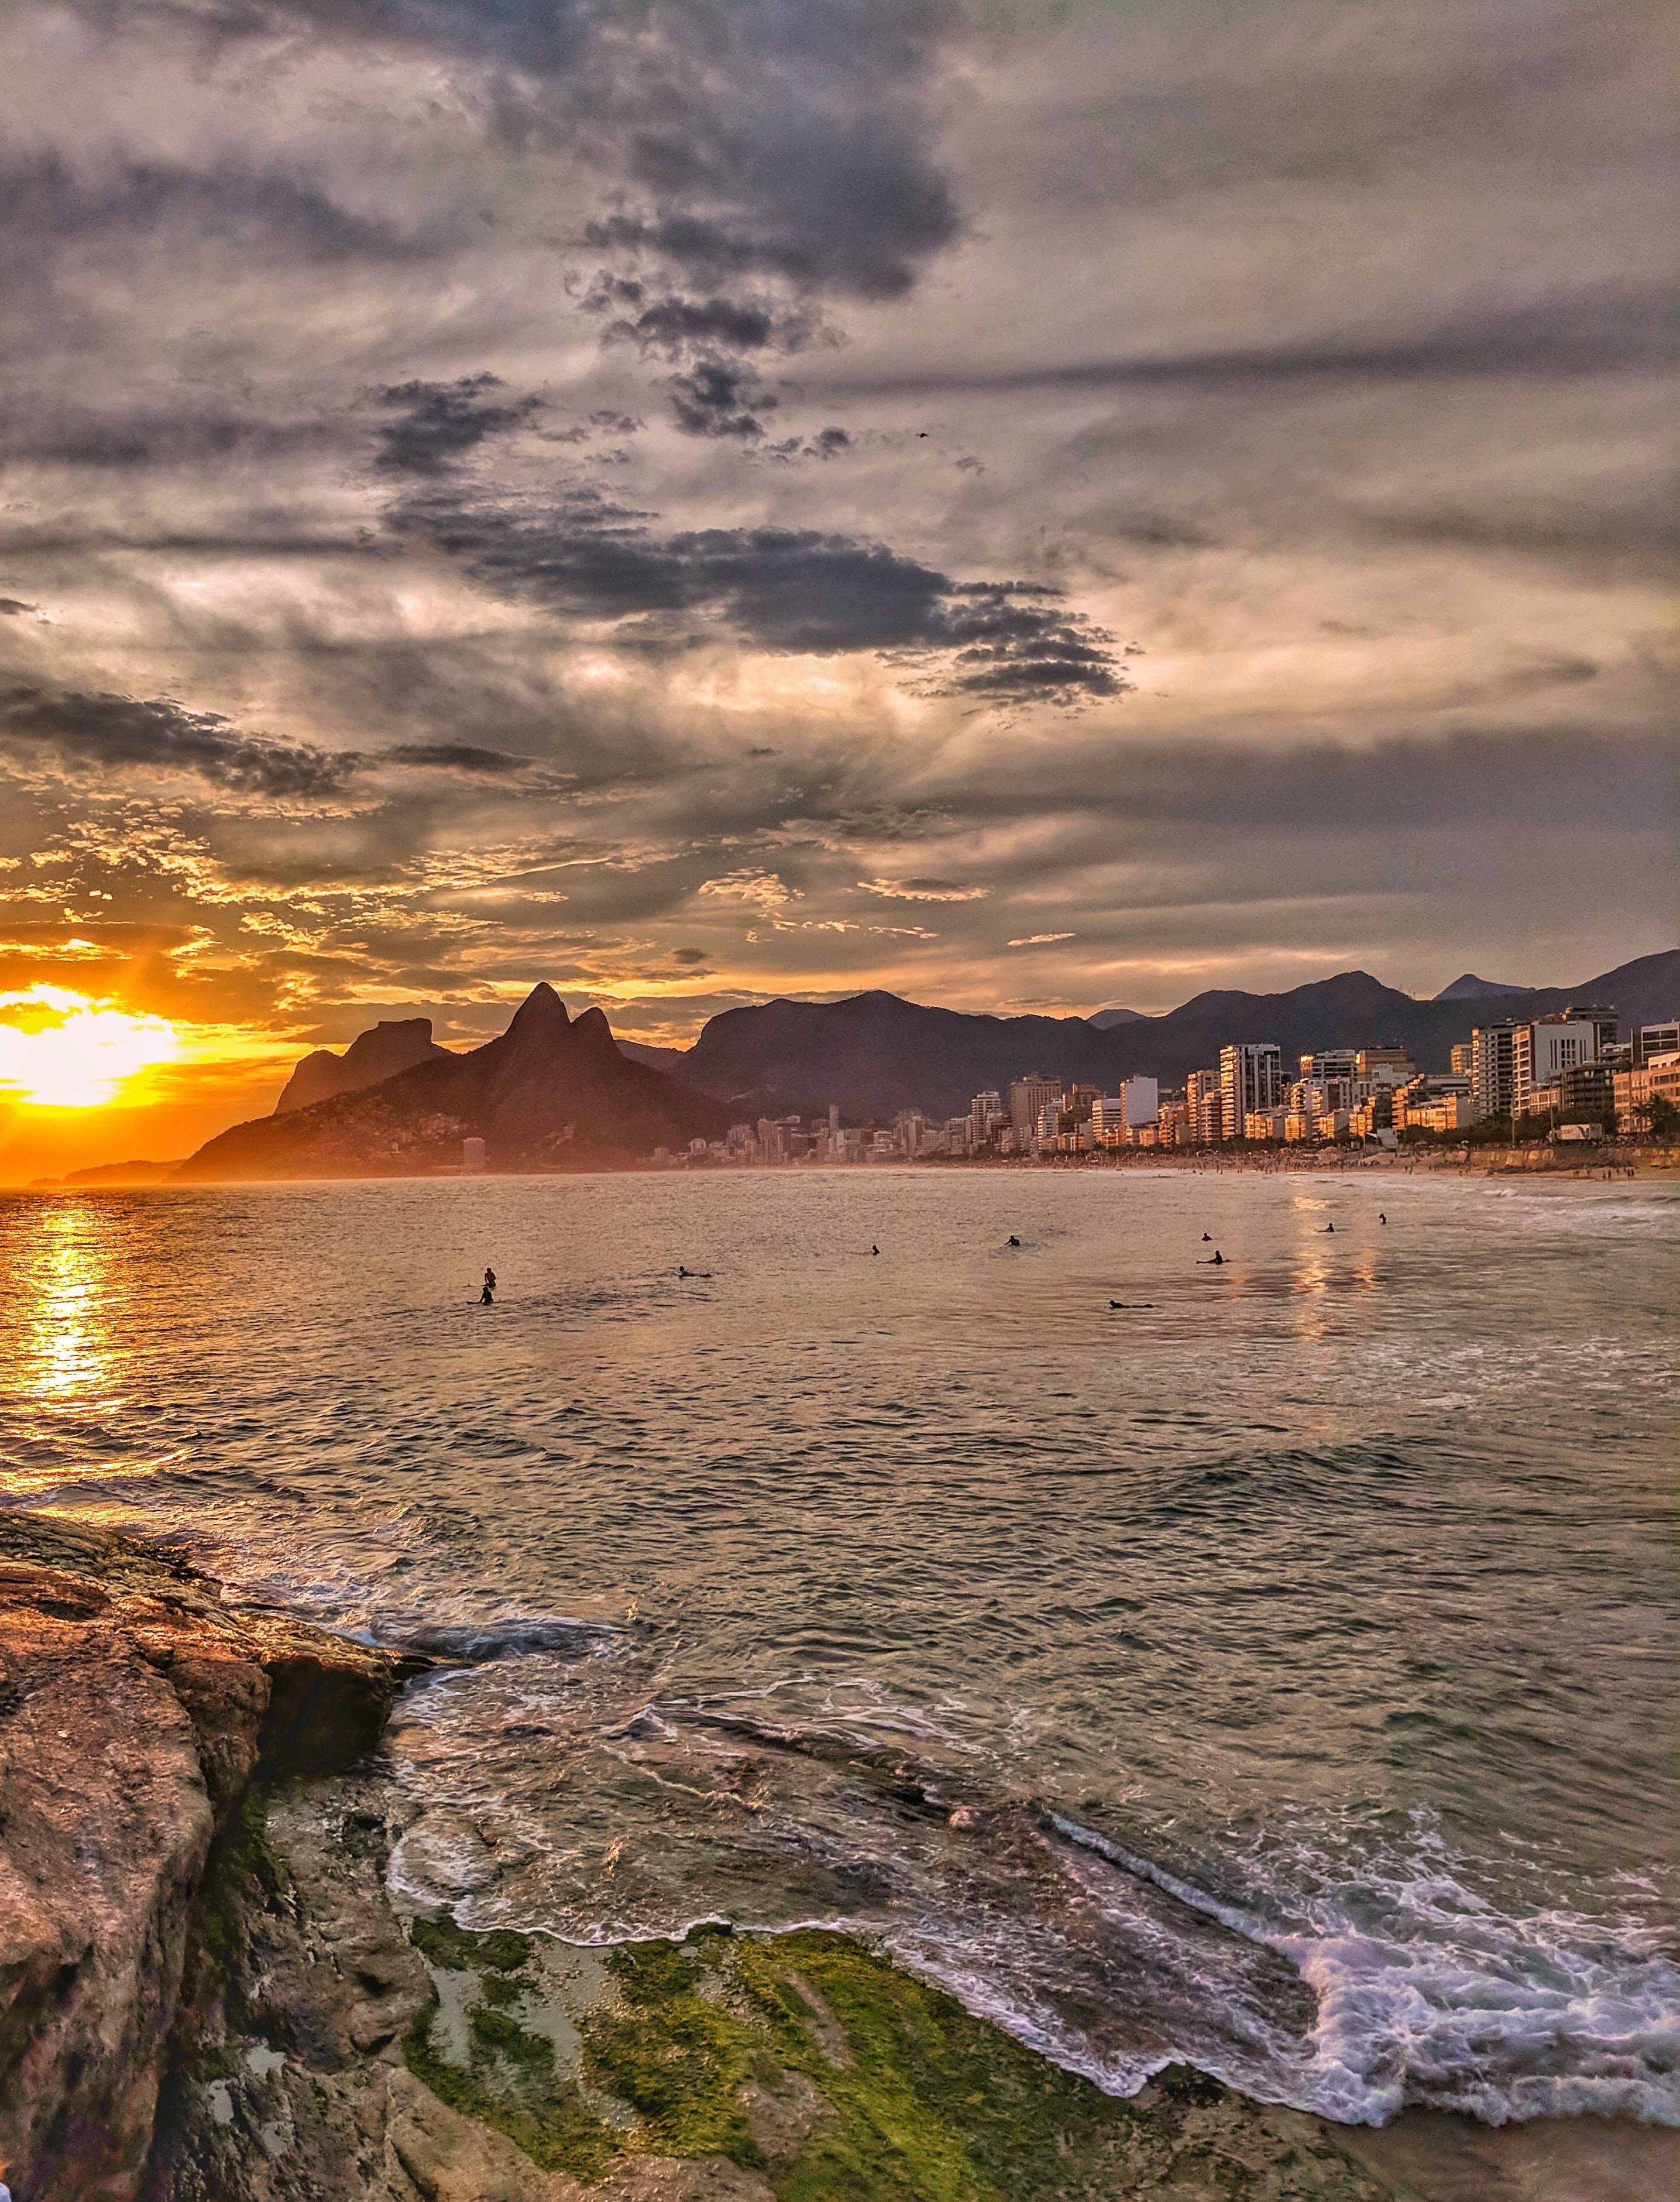 After a few seconds, I saw 3 files in my output bucket: ```sh gsutil ls gs://knative-atamel-images-output gs://knative-atamel-images-output/beach-400x400-watermark.jpeg gs://knative-atamel-images-output/beach-400x400.png gs://knative-atamel-images-output/beach-labels.txt ``` We can see the labels `Sky,Body of water,Sea,Nature,Coast,Water,Sunset,Horizon,Cloud,Shore` in the text file, and the resized and watermarked image: 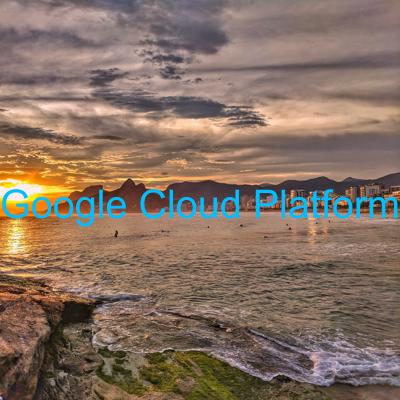 ## BigQuery Processing Pipeline This pipeline example is a schedule driven pipeline, which queries and finds the daily number of COVID-19 cases for the UK and Cyprus. I used a public COVID-19 dataset on BigQuery to get the data, generate charts, and send myself one email for each country, once a day, containing those charts. ### Architecture Here's the architecture of the pipeline. 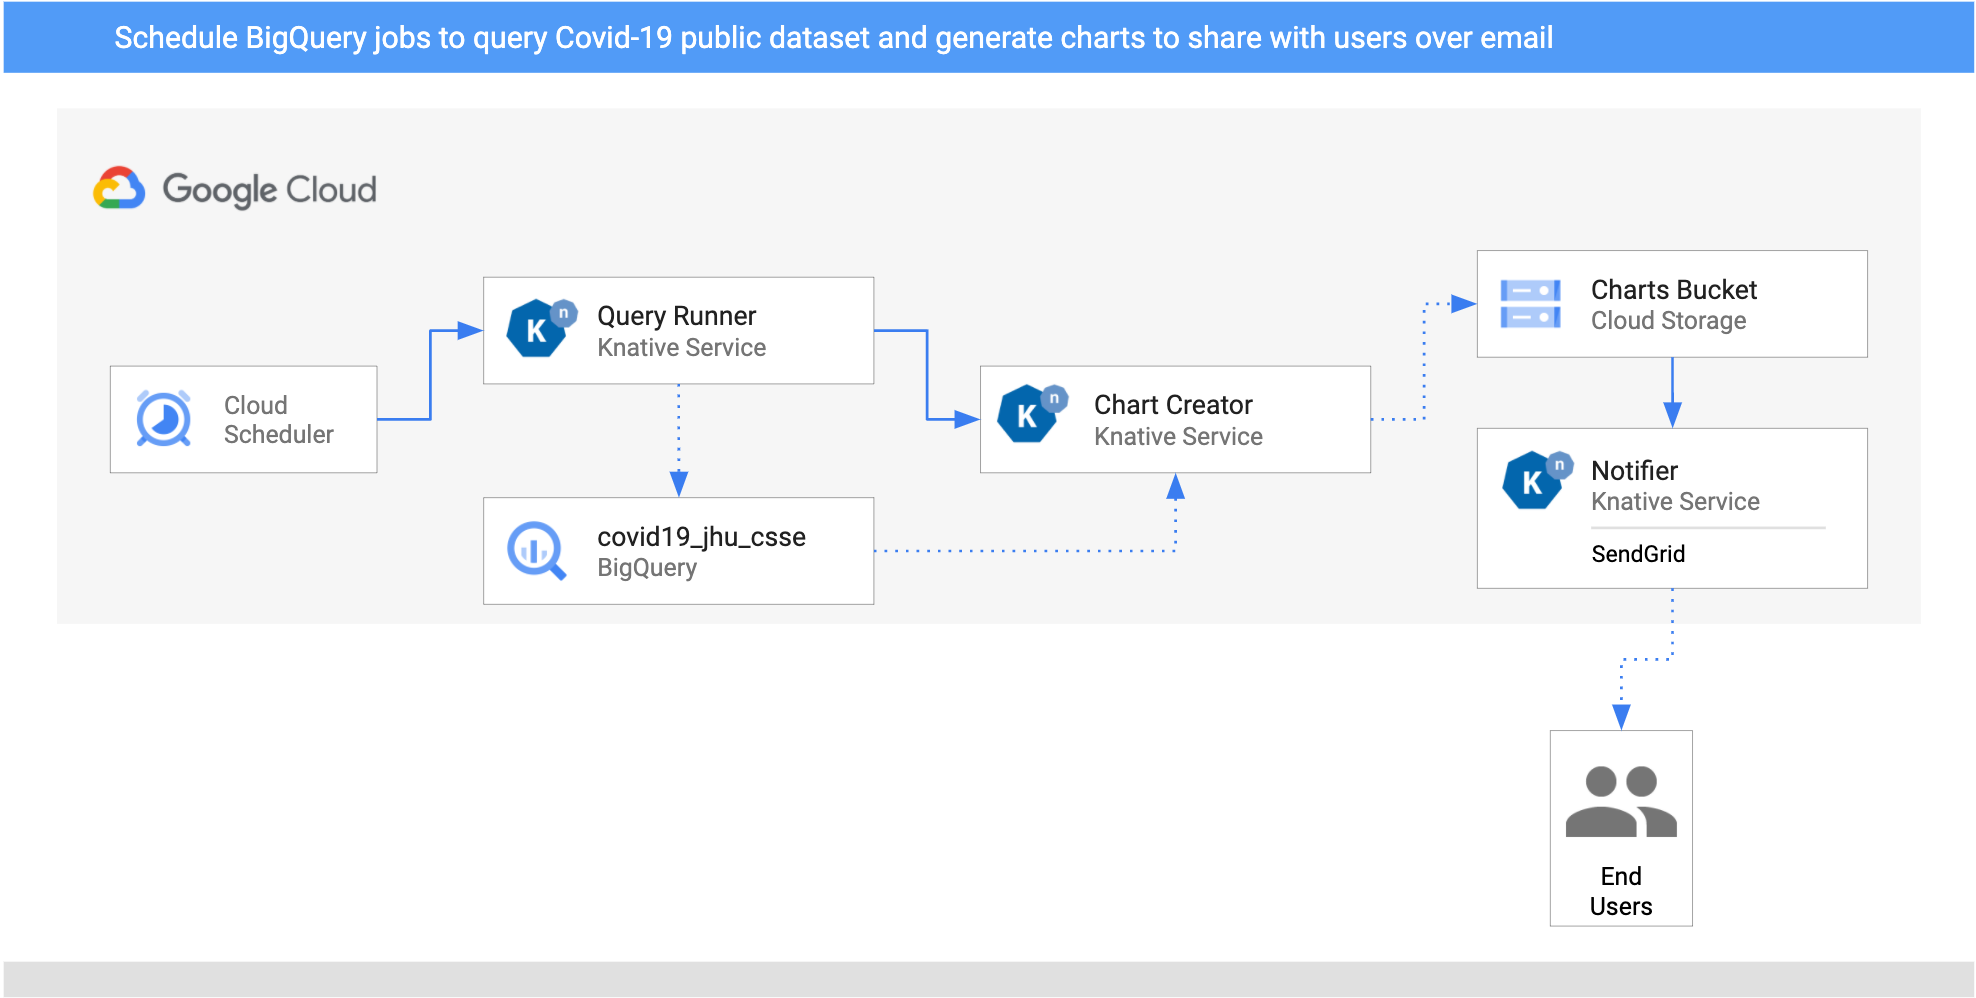 1. I setup two `CloudSchedulerSources` for two countries (United Kingdom and Cyprus) to call the `QueryRunner` service once a day. 2. The QueryRunner service receives the scheduler events for the UK and Cyprus, queries COVID-19 cases for each of them using BigQuery's public COVID-19 data set, and saves the results in a separate BigQuery table. After this is done, the QueryRunner service returns a custom CloudEvent of type `dev.knative.samples.querycompleted`. 3. The ChartCreator service receives the `querycompleted` CloudEvent, creates a chart from BigQuery data using `Matplotlib`, and saves it to a Cloud Storage bucket. 4. The notifier service is another receives the `com.google.cloud.storage.object.finalize` CloudEvent from the bucket through a CloudStorageSource, and sends an email notification to users using SendGrid. ### Test the pipeline The CloudSchedulerSource creates CloudScheduler jobs: ```bash gcloud scheduler jobs list ID LOCATION SCHEDULE (TZ) TARGET_TYPE STATE cre-scheduler-2bcb33d8-3165-4eca-9428-feb99bc320e2 europe-west1 0 16 * * * (UTC) Pub/Sub ENABLED cre-scheduler-714c0b82-c441-42f4-8f99-0e2eac9a5869 europe-west1 0 17 * * * (UTC) Pub/Sub ENABLED ``` Trigger the jobs: ```bash gcloud scheduler jobs run cre-scheduler-2bcb33d8-3165-4eca-9428-feb99bc320e2 ``` You should get an email with with a chart similar to this in a few minutes:  This wraps up my post. As I already mentioned, if you want more detailed instructions, you can check out [image-processing-pipeline](https://github.com/meteatamel/knative-tutorial/blob/master/docs/image-processing-pipeline.md) and [bigquery-processing-pipeline](https://github.com/meteatamel/knative-tutorial/blob/master/docs/bigquery-processing-pipeline.md) as part of my [Knative Tutorial](https://github.com/meteatamel/knative-tutorial) If you have questions/comments, feel free to reach out to me on Twitter [@meteatamel](https://twitter.com/meteatamel)). --- By [Mete Atamel](https://twitter.com/meteatamel) - Developer Advocate, Google Cloud