* getting-started-dotnet-monitor-metrics * fix markdownlint * Raname NextGen.AutoInstrumentation to just next-gen * Remove logger code. |
||
|---|---|---|
| .. | ||
| images | ||
| Program.cs | ||
| README.md | ||
| getting-started-dotnet-monitor-metrics.csproj | ||
README.md
Getting Started with dotnet-monitor, Prometheus and Grafana
- Produce metrics from the application
- Collect metrics using dotnet-monitor
- Collect metrics using Prometheus
- Explore metrics using Grafana
Produce metrics from the application
Create a new console application and run it:
dotnet new console --output getting-started-dotnet-monitor-metrics
cd getting-started-dotnet-monitor-metrics
dotnet run
Now copy the code from Program.cs and run the application again.
For our learning purpose, use a while-loop to keep increasing the counter value until any key is pressed.
Console.WriteLine("Press any key to exit");
while (!Console.KeyAvailable)
{
    Thread.Sleep(1000);
    MyFruitCounter.Add(1, new("name", "apple"), new("color", "red"));
    MyFruitCounter.Add(2, new("name", "lemon"), new("color", "yellow"));
    MyFruitCounter.Add(1, new("name", "lemon"), new("color", "yellow"));
    ...
    ...
    ...
}
Collect metrics using dotnet-monitor
Follow the install steps to download the dotnet-monitor.
Configuration
-
Configure dotnet-monitor API key: To secure access to the dotnet-monitor endpoints, you can set up an API key authentication by following the steps outlined in Configuring API Key Authentication. If your use case is limited to a test environment, you might opt to bypass API key configuration by using the
--no-authswitch when running dotnet-monitor. Learn more about dotnet-monitor authentication here. -
Set a default process and customize metrics collection: To monitor a specific local process and capture custom metrics, use a settings.json file. This file defines both the default process to monitor and the specific meters to collect metrics. For instance, to monitor a
getting-started-dotnet-monitor-metricsprocess and collect metrics from the "MyCompany.MyProduct.MyLibrary" meter, create a settings.json file with the following content:
{
    "$schema": "https://aka.ms/dotnet-monitor-schema",
    "DefaultProcess": {
        "Filters": [{
            "Key": "ProcessName",
            "Value": "getting-started-dotnet-monitor-metrics"
        }]
    },
    "Metrics": {
        "Meters": [
            {
                "MeterName": "MyCompany.MyProduct.MyLibrary"
            }
        ]
    }
}
When starting dotnet-monitor, specify the path to this settings.json file using
the --configuration-file-path switch.
Running dotnet-monitor
Run dotnet-monitor in a command prompt or terminal. If you have configured an
API key, ensure to use it. If you are running in a test environment and prefer
not to use authentication, you can start dotnet-monitor with the --no-auth
switch:
dotnet-monitor collect --no-auth --configuration-file-path path/to/settings.json
Or, if you have set up an API key:
dotnet-monitor collect --configuration-file-path path/to/settings.json
This command starts the collection process. By default, dotnet-monitor listens on http://localhost:52325/.
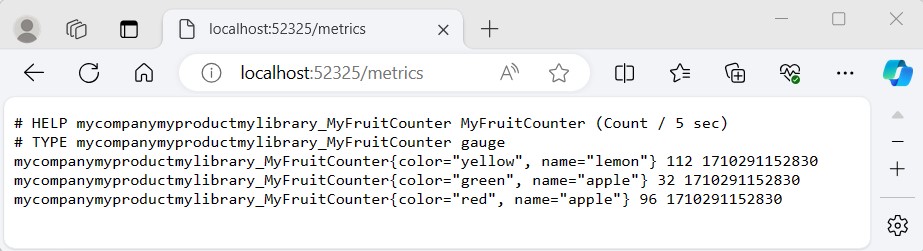
Access and validate the metrics
Access the metrics endpoint. Once dotnet-monitor is running, you can access the metrics endpoint using a web browser or a tool like curl. The default URL for metrics is http://localhost:52325/metrics. If you are using authentication, include the API key in your request header. For example, using curl with an API key:
curl -H "Authorization: Bearer <Your-API-Key>" http://localhost:52325/metrics
Without authentication (in test environments):
curl http://localhost:52325/metrics
Now, we understand how we can configure dotnet-monitor to collect metrics. Next, we are going to learn about how to use Prometheus to capture metrics from dotnet-monitor.
Collect metrics using Prometheus
Follow the first steps to download the latest release of Prometheus.
Prometheus Configuration
After finished downloading, extract it to a local location that's easy to
access. We will find the default Prometheus configuration YAML file in the
folder, named prometheus.yml.
Let's create a new file in the same location as where prometheus.yml locates,
and named the new file as otel.yml for this exercise. Then, copy and paste the
entire content below into the otel.yml file we have created just now.
global:
  scrape_interval: 10s
  evaluation_interval: 10s
scrape_configs:
  - job_name: "otel"
    static_configs:
      - targets: ["localhost:52325"]
Start Prometheus
Follow the instructions from starting-prometheus to start the Prometheus server and verify it has been started successfully.
Please note that we will need pass in otel.yml file as the argument:
./prometheus --config.file=otel.yml
View results in Prometheus
To use the graphical interface for viewing our metrics with Prometheus, navigate
to http://localhost:9090/graph, and type
mycompanymyproductmylibrary_MyFruitCounter in the expression bar of the UI;
finally, click the execute button.
We should be able to see the following chart from the browser:

From the legend, we can see that the instance name and the job name are the
values we have set in otel.yml.
Congratulations!
Now we know how to configure Prometheus server and collect our metrics using dotnet-monitor. Next, we are going to explore a tool called Grafana, which has powerful visualizations for the metrics.
Explore metrics using Grafana
Start the standalone Grafana server (grafana-server.exe or
./bin/grafana-server, depending on the operating system). Then, use the
browser to navigate to http://localhost:3000/.
Follow the instructions in the Grafana getting started doc to log in.
After successfully logging in, click on the explore option on the left panel of the website - we should be able to write some queries to explore our metrics now!
Feel free to find some handy PromQL here.
In the below example, the query targets to find out what is the per-second rate of increase of myFruitCounter over the past 5 minutes:
