|
|
||
|---|---|---|
| .. | ||
| docker/ot | ||
| images | ||
| README.md | ||
| index.js | ||
| package.json | ||
README.md
Overview
This example shows how to use @opentelemetry/sdk-trace-base to instrument a simple Node.js application - e.g. a batch job.
Our example will export spans data simultaneously on Console and Jaeger, however you can run your code anywhere and can use any exporter that OpenTelemetry supports.
Installation
# from this directory
npm install
(Optional) Setup Jaeger Tracing: needs to be running on localhost port 16686.
Run the Application
# from this directory
npm start
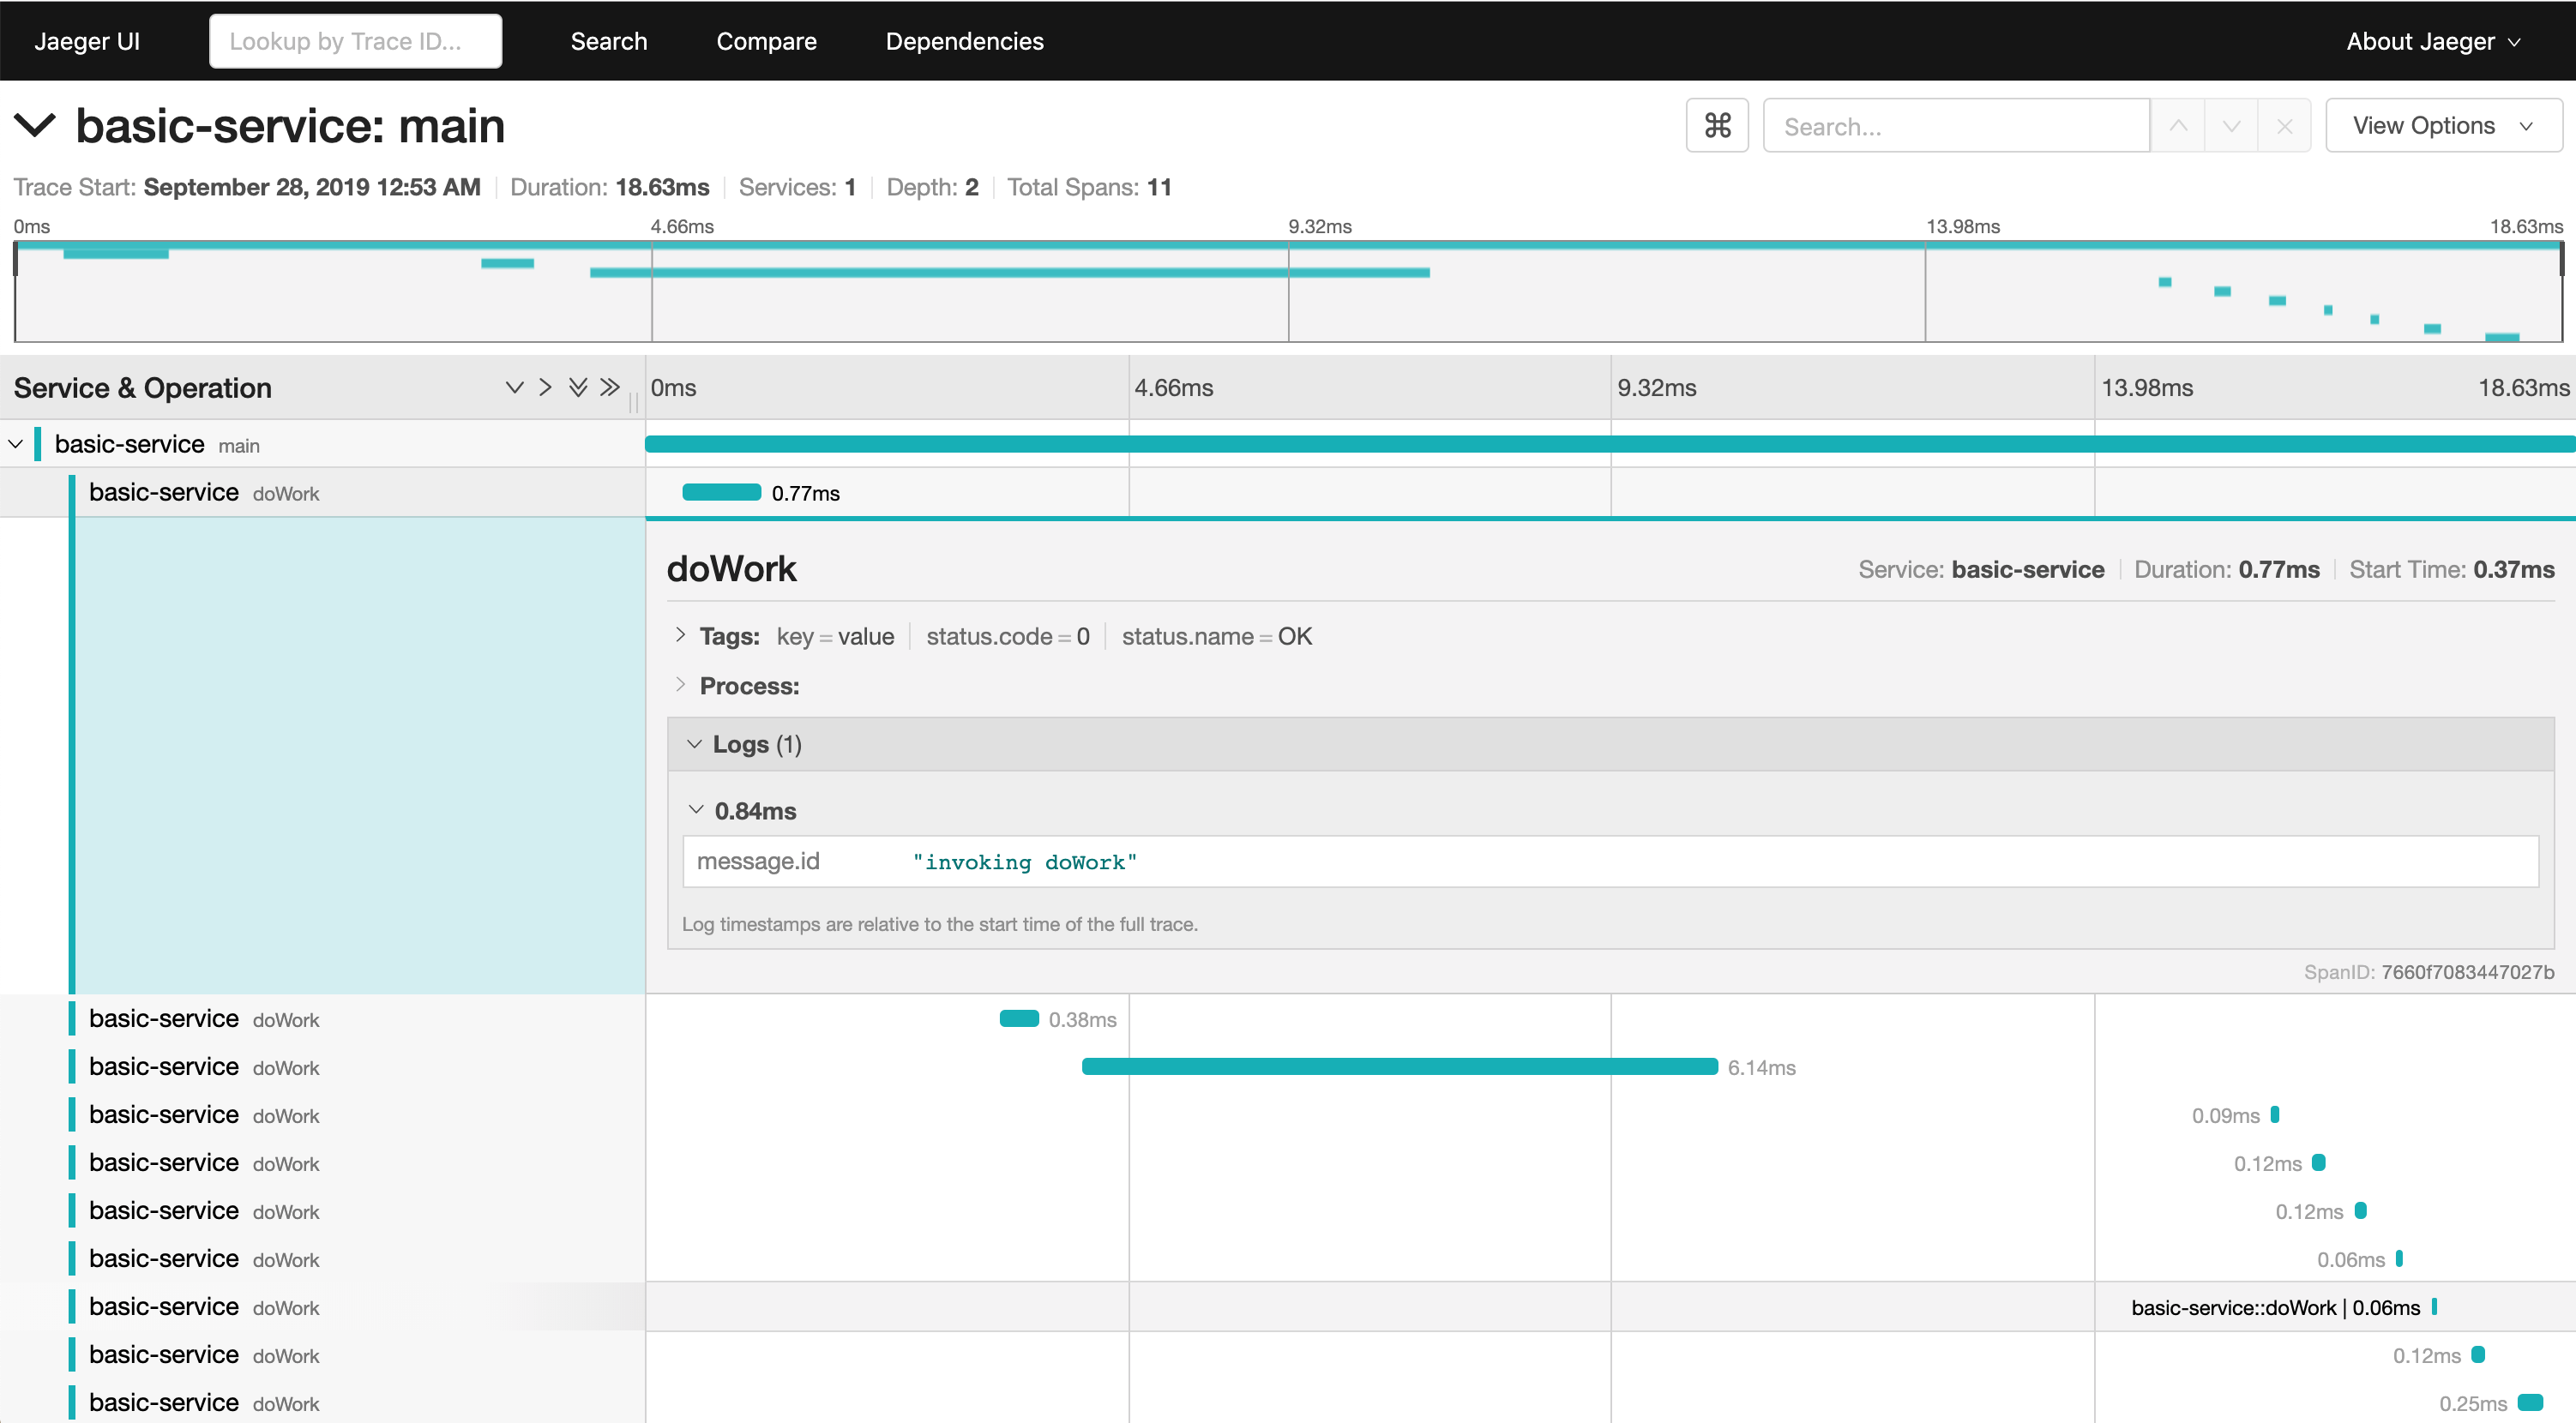
Jaeger UI
Open the Jaeger UI in your browser http://localhost:16686

Select basic-service under Service Name and click on Find Traces.
Click on the trace to view its details.
Useful links
- For more information on OpenTelemetry, visit: https://opentelemetry.io/
- For more information on tracing, visit: https://github.com/open-telemetry/opentelemetry-js/tree/main/packages/opentelemetry-sdk-trace-base
LICENSE
Apache License 2.0