Co-authored-by: Mayur Kale <mayurkale@google.com> Co-authored-by: Daniel Dyla <dyladan@users.noreply.github.com> |
||
|---|---|---|
| .. | ||
| docker | ||
| images | ||
| README.md | ||
| metrics.js | ||
| package.json | ||
| tracing.js | ||
README.md
Overview
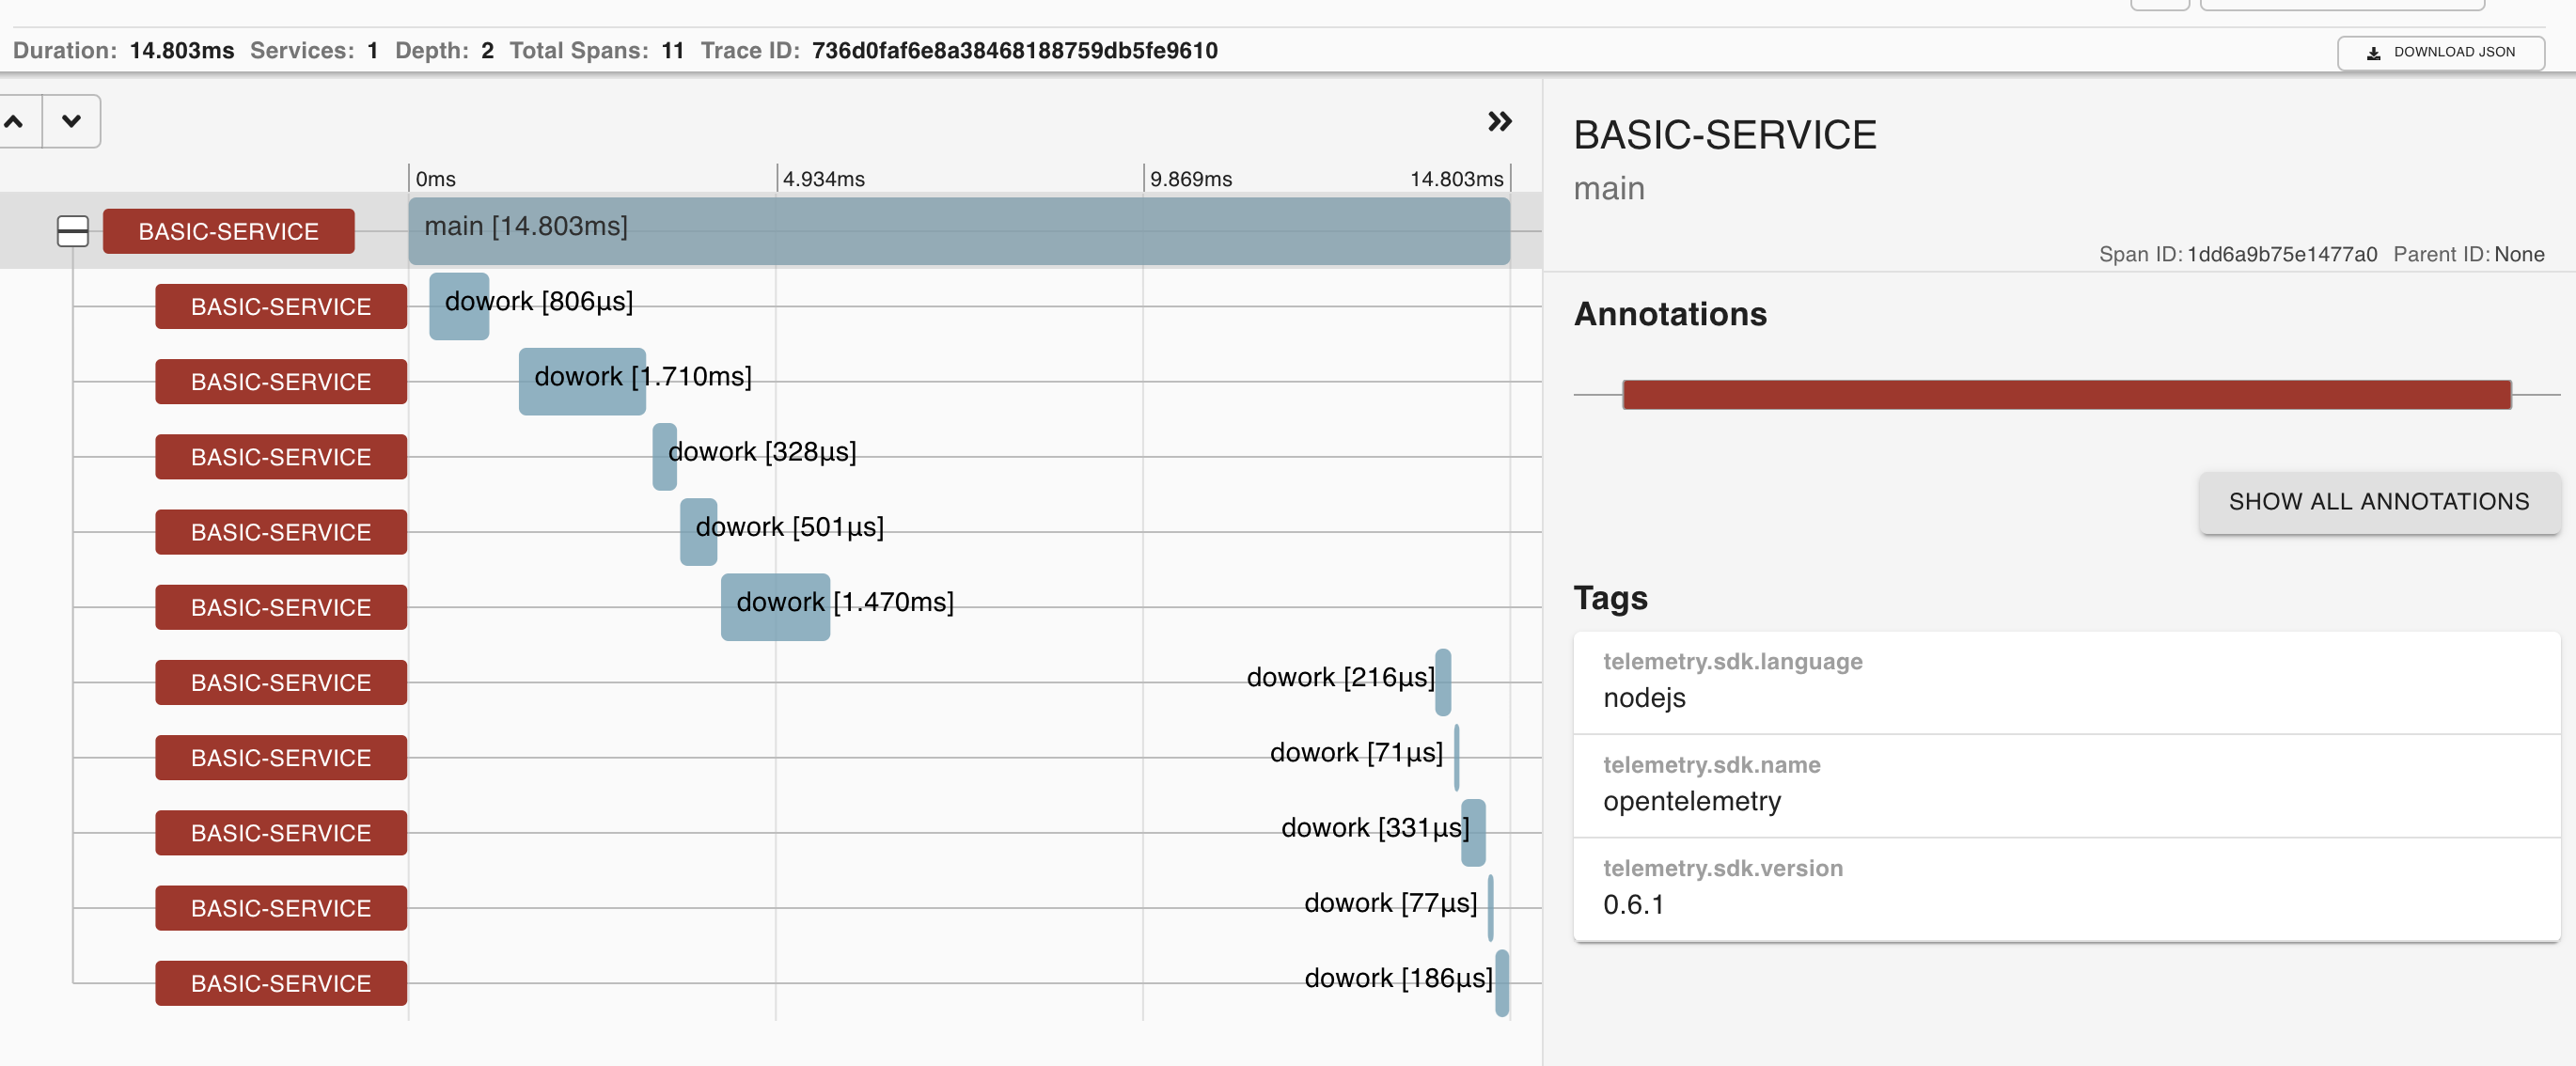
This example shows how to use @opentelemetry/exporter-collector to instrument a simple Node.js application.
This example will export spans data simultaneously using Exporter Collector and grpc. It will use proto format.
Installation
# from this directory
npm install
Run the Application
-
Run docker
# from this directory npm run docker:start -
Run tracing app
# from this directory npm start:tracing -
Run metrics app
# from this directory npm start:metrics -
Open page at http://localhost:9411/zipkin/ - you should be able to see the spans in zipkin
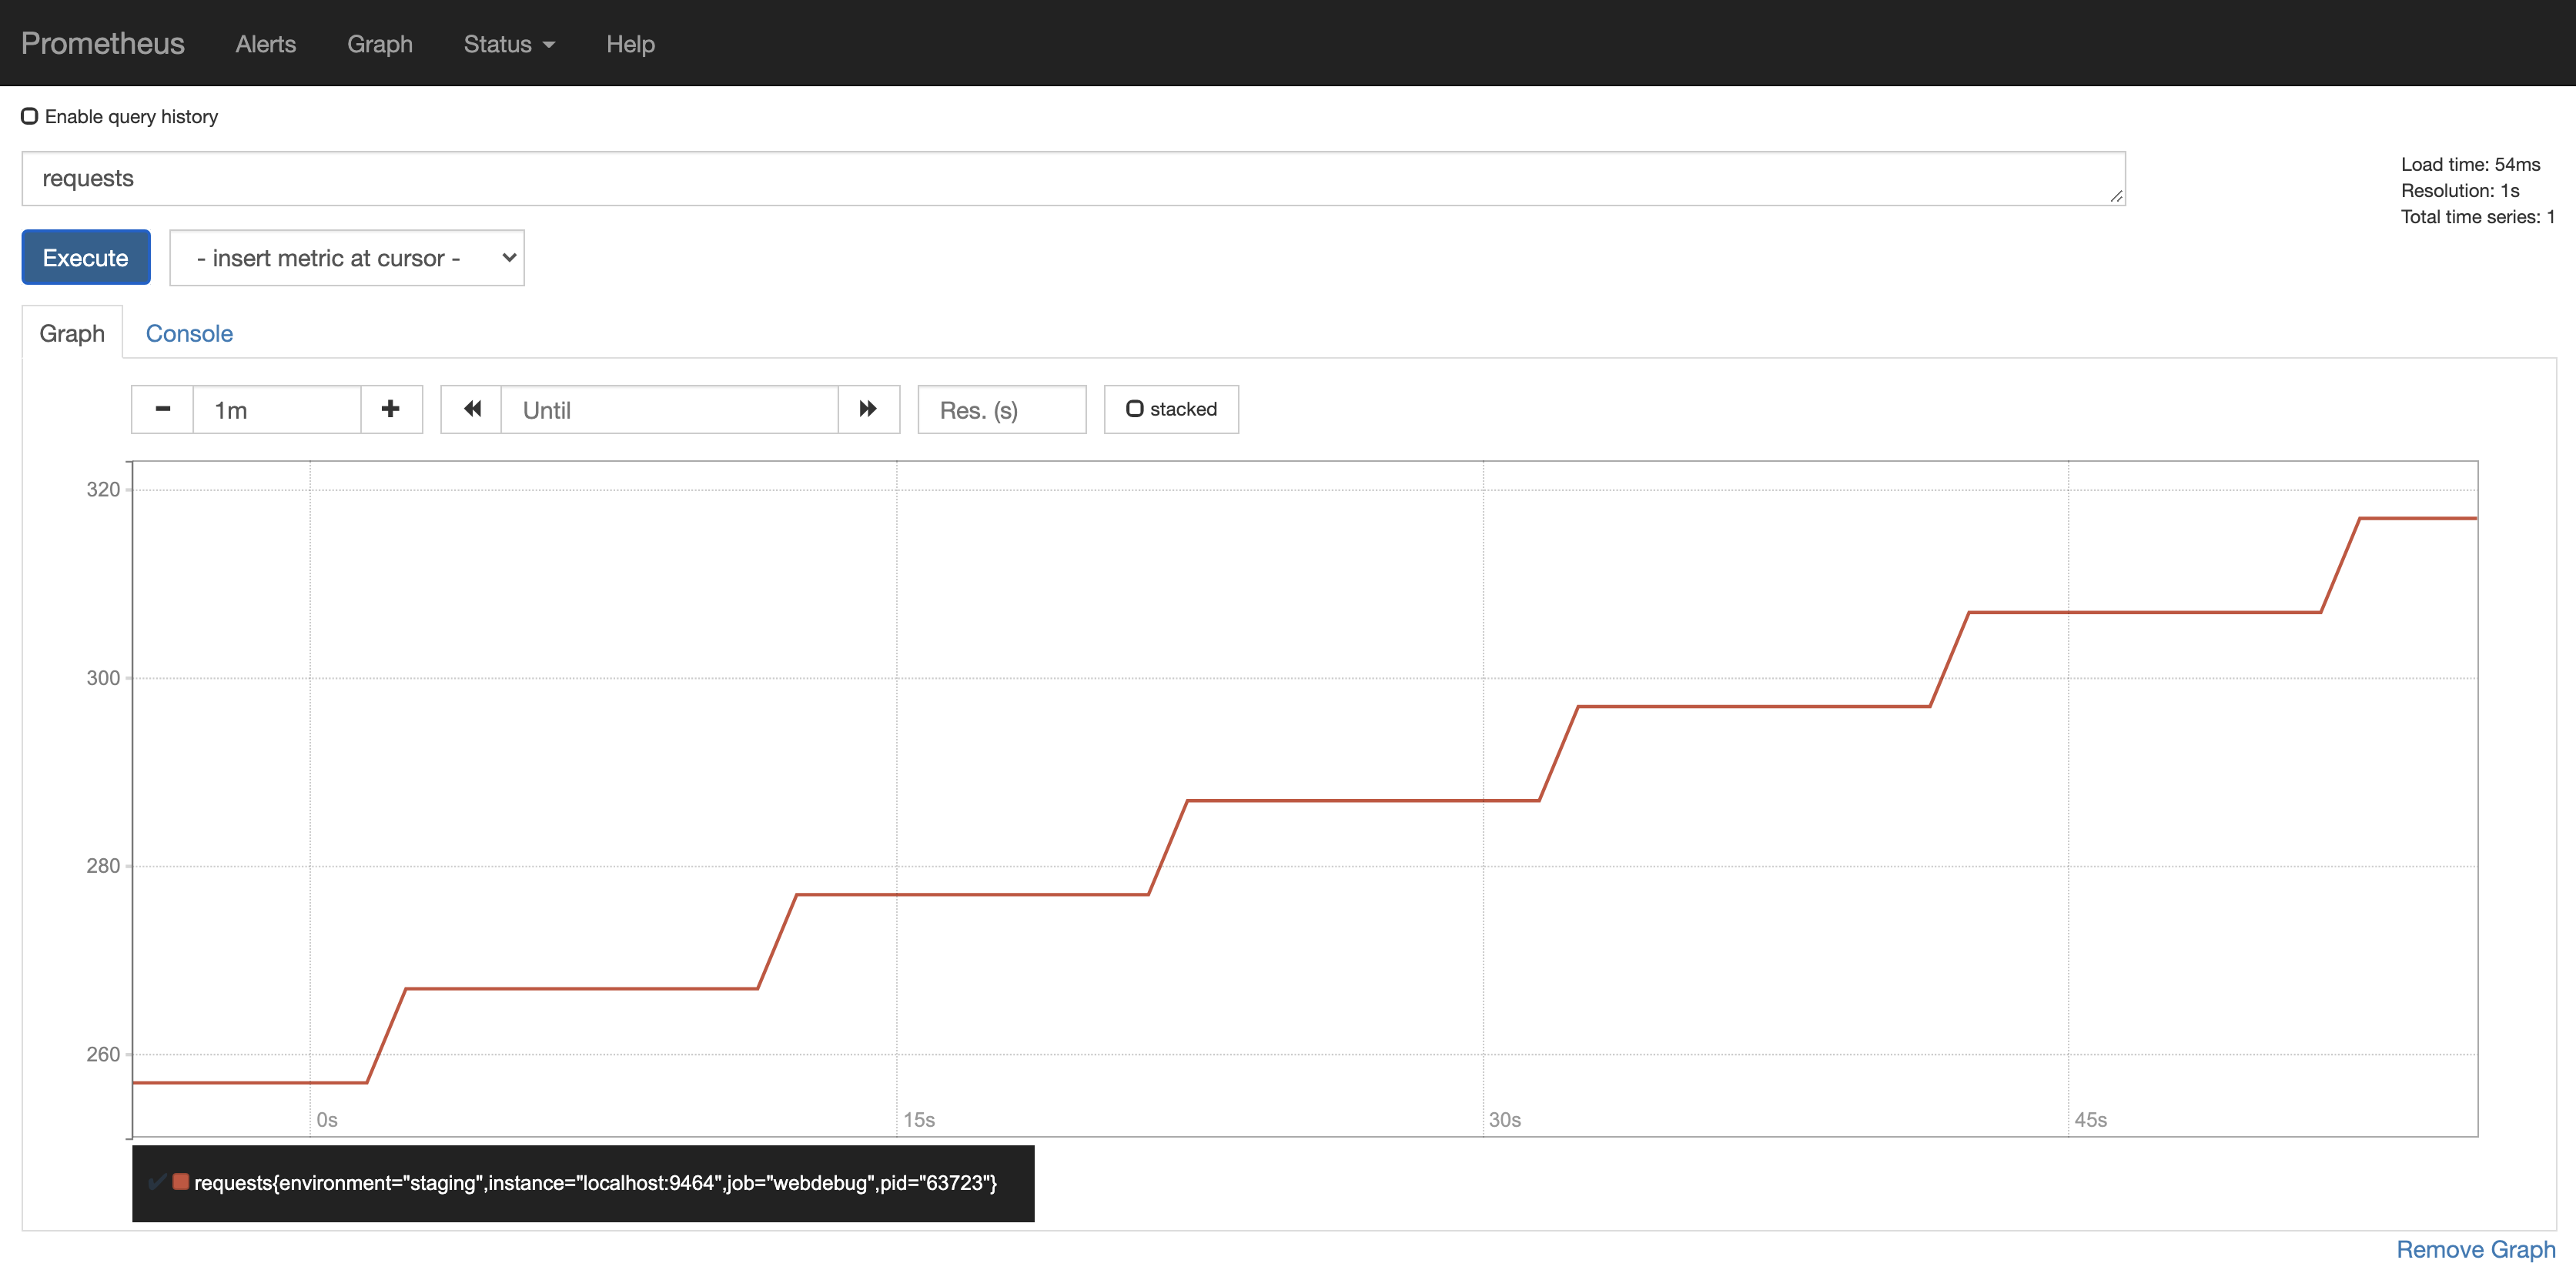
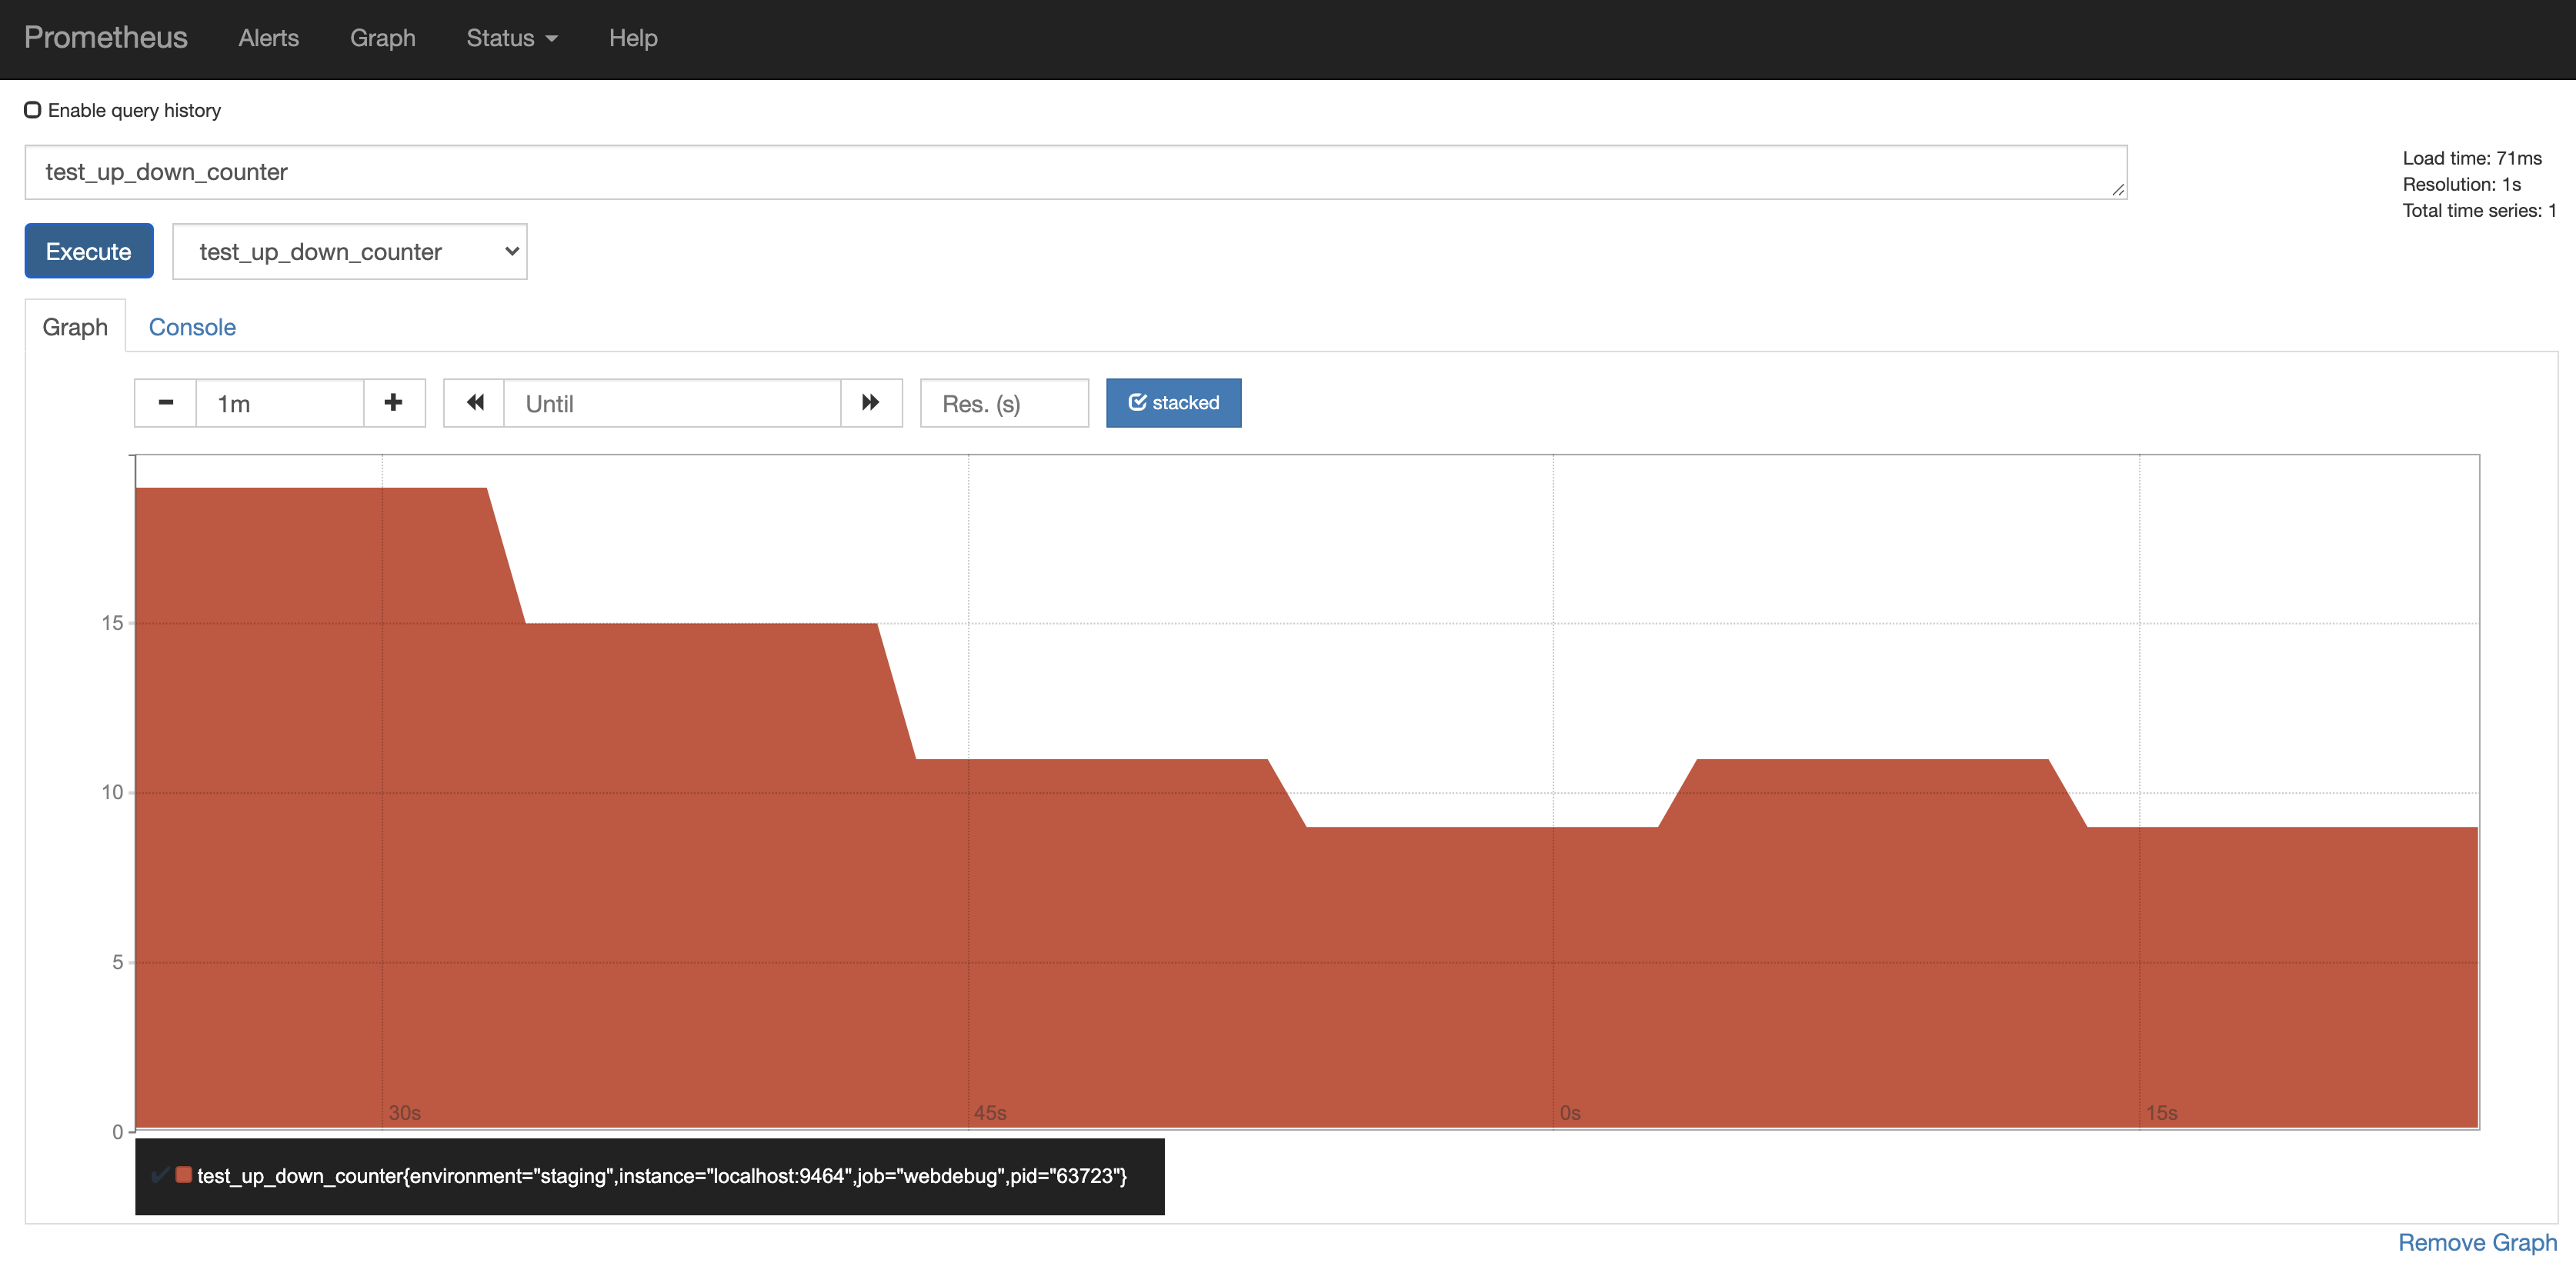
Prometheus UI
The prometheus client will be available at http://localhost:9090.
Note: It may take some time for the application metrics to appear on the Prometheus dashboard.
Useful links
- For more information on OpenTelemetry, visit: https://opentelemetry.io/
- For more information on tracing, visit: https://github.com/open-telemetry/opentelemetry-js/tree/master/packages/opentelemetry-tracing
LICENSE
Apache License 2.0