1.4 KiB
Tutorial for Chaos Mesh Data source
Configure the data source
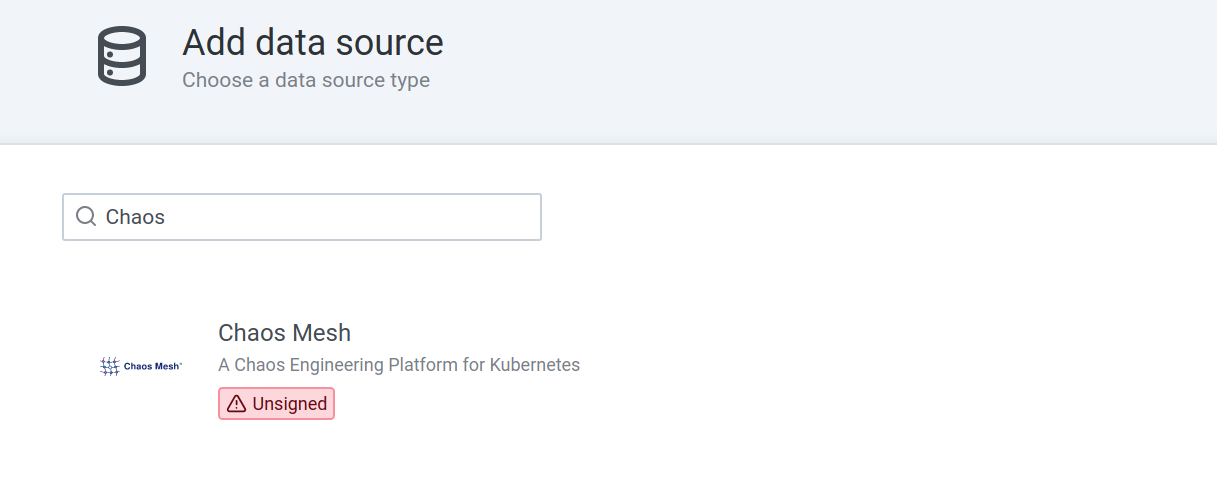
Go to Grafana -> Configuration -> Data Sources, click Add data source button.

Enter Chaos Mesh into the search bar and then you can see the data source.
Enter the URL of Chaos Dashboard, and click Save & Test to check availability.
It is best to make sure your network can access this URL as well.

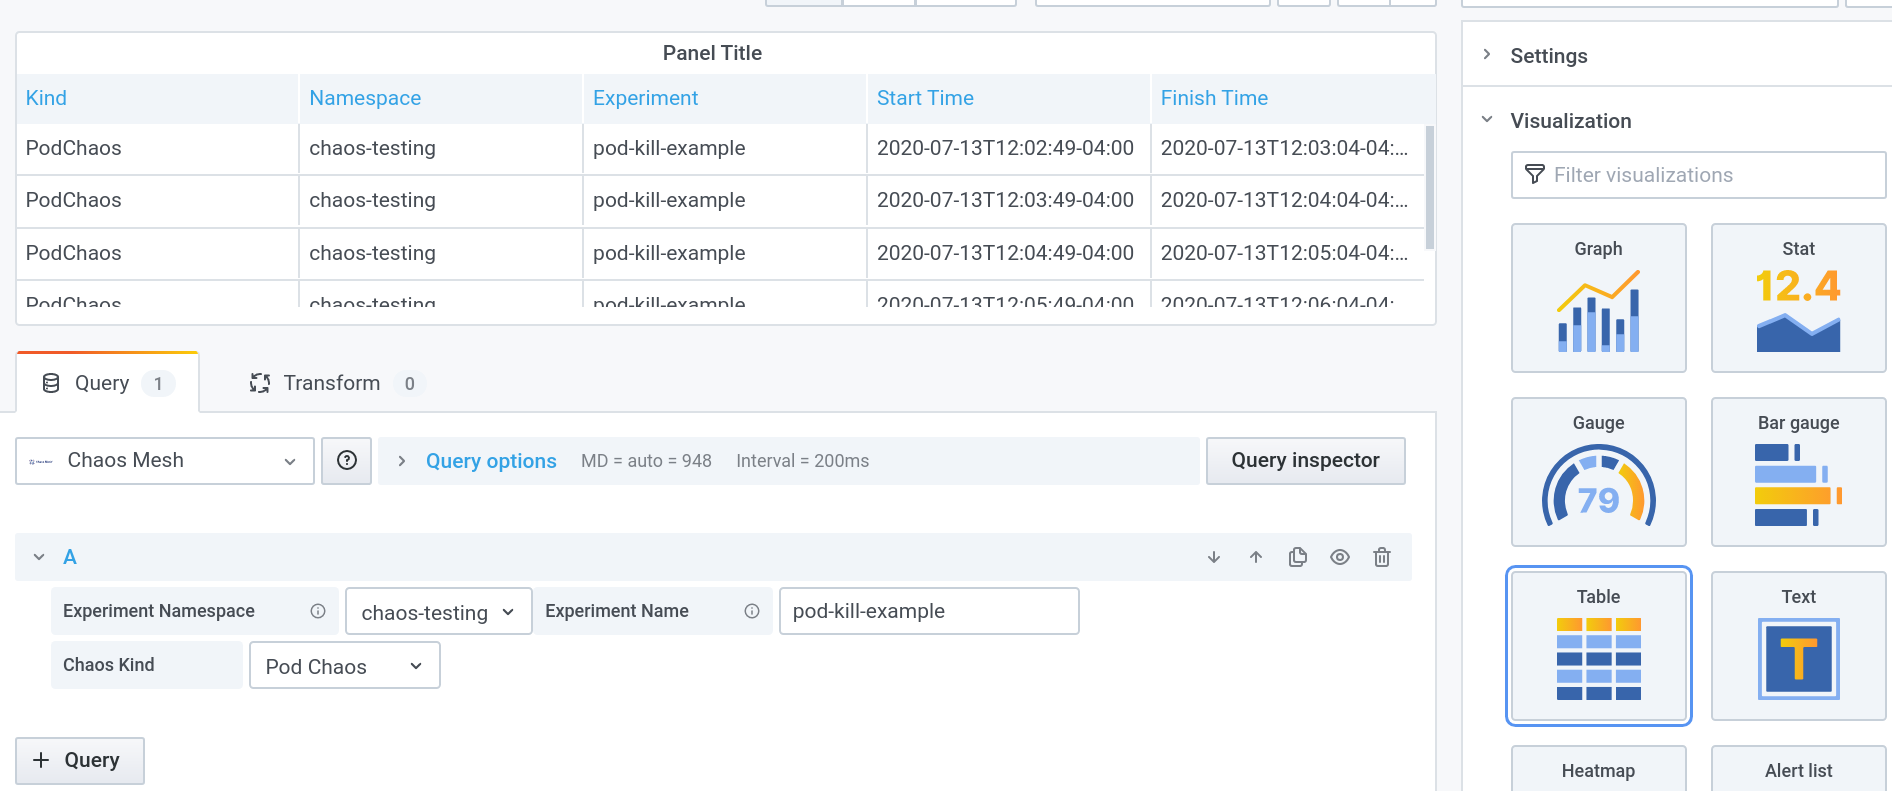
Chaos Events Query
Add a new query panel and choose Chaos Mesh Data source. Enter the required parameters below for what experiment you want to search.
Please note that Chaos Mesh Data source only supports Table type visualization.
Chaos Events Annotations Query
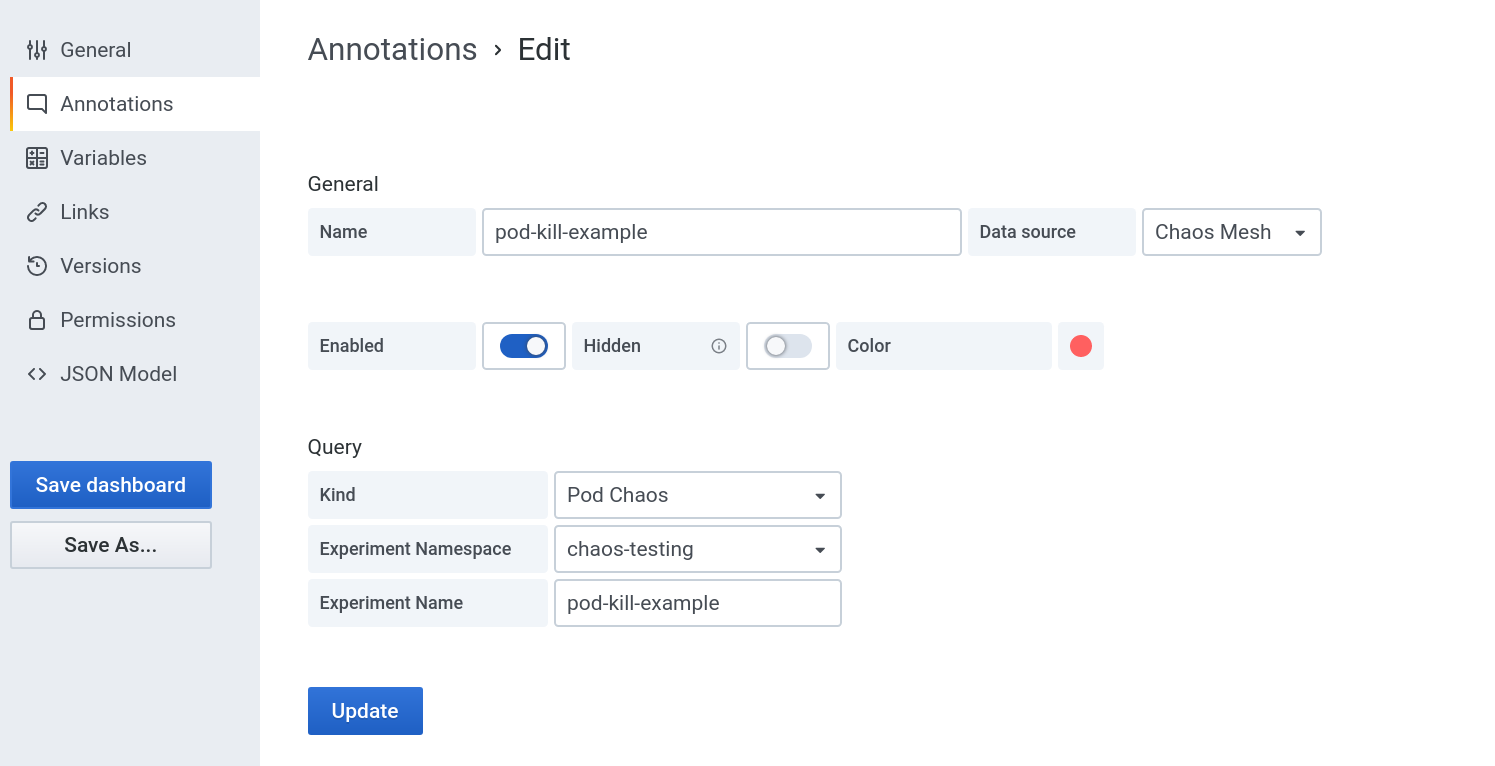
Configure Annotation
Add a new annotation, choose type as Chaos Mesh. Enter the required parameters below for what experiment you want to search.
View the results
To view the annotations, you should have a panel. If the annotation is enabled and there are some Chaos events at the time range, you can see the annotations in your dashboard.
There is also a link Event Details, you can click this link and go to Chaos Dashboard UI to see the details of that event.
