4.1 KiB
Set up distributed tracing with Azure Monitor
Dapr integrates with Application Monitor through OpenTelemetry's default exporter along with a dedicated agent known as Local Forwarder.
How to configure distributed tracing with Azure Monitor
The following steps will show you how to configure Dapr to send distributed tracing data to Azure Monitor.
Setup Azure Monitor
- First, you'll need an Azure account. Please see instructions here to apply for a free Azure account.
- Follow instructions here to create a new Application Insights resource.
Setup the Local Forwarder
The Local Forwarder listens to OpenTelemetry's traces through Please follow the insturctions here to setup Local Forwarder as a local service or daemon.
NOTE: At the time of writing, there's no official guidance on packaging and running the Local Forwarder as a Docker container. To use Local Forwarder on Kubernetes, you'll need to package the Local Forwarder as a Docker container and register a ClusterIP service. Then, you should set the service as the export target of the native exporter.
How to configure distributed tracing with Azure Monitor
You'll need two YAML files - a Dapr configuration file that enables tracing, and a native export configuration file that configures the native exporter.
- Create the following YAML files:
- native.yaml
apiVersion: dapr.io/v1alpha1
kind: Component
metadata:
  name: native
spec:
  type: exporters.native
  metadata:
  - name: enabled
    value: "true"
  - name: agentEndpoint
    value: "<Local forwarder address, for example: 50.140.60.170:6789>"
- tracing.yaml
apiVersion: dapr.io/v1alpha1
kind: Configuration
metadata:
  name: tracing
spec:
  tracing:
    enabled: true
    expandParams: true
    includeBody: true
- When running under local mode, copy tracing.yaml to a components folder under the same folder where you run you application. When running under Kubernetes model, use kubectl to apply the above CRD files:
kubectl apply -f tracing.yaml
kubectl apply -f native.yaml
- When running in the local mode, you need to launch Dapr with the
--configparameter:
dapr run --app-id mynode --app-port 3000 --config ./tracing.yaml node app.js
When running in the Kubernetes model, you need to add a dapr.io/config annotation to your container that you want to participate in the distributed tracing, as shown in the following example:
apiVersion: apps/v1
kind: Deployment
metadata:
  ...
spec:
  ...
  template:
    metadata:
      ...
      annotations:
        dapr.io/enabled: "true"
        dapr.io/id: "calculator-front-end"
        dapr.io/port: "8080"
        dapr.io/config: "tracing"
That's it! There's no need include any SDKs or instrument your application code in anyway. Dapr automatically handles distributed tracing for you.
NOTE: You can register multiple exporters at the same time, and tracing logs will be forwarded to all registered exporters.
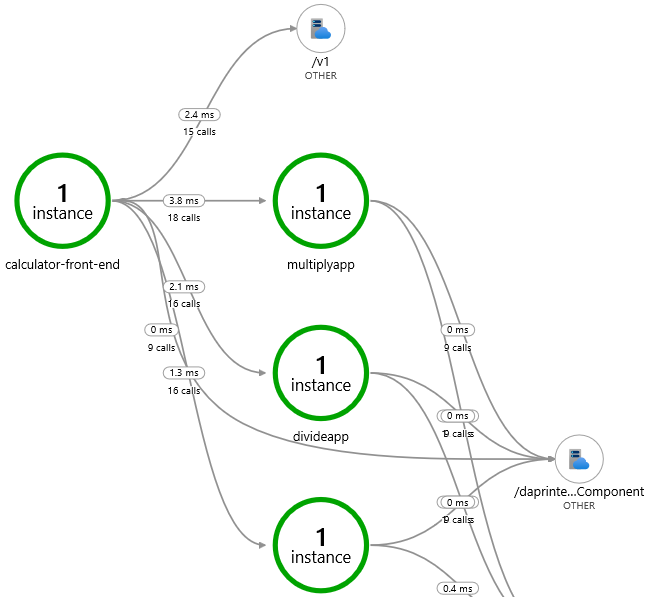
Generate some workloads. And after a few minutes, you should see tracing logs appearing in your Application Insights resource. And you can also use Application map to examine the topology of your services, as shown below:
Tracing Configuration
The tracing section under the Configuration spec contains the following properties:
tracing:
    enabled: true
    expandParams: true
    includeBody: true
The following table lists the different properties.
| Property | Type | Description |
|---|---|---|
| enabled | bool | Set tracing to be enabled or disabled |
| expandParams | bool | When true, expands parameters passed to HTTP endpoints |
| includeBody | bool | When true, includes the request body in the tracing event |