4.9 KiB
Set up Prometheus and Grafana
This document shows how to install Prometheus and Grafana to view metrics.
Prerequisites
Contents
Install Prometheus and Grafana
- Create namespace for monitoring tool
kubectl create namespace dapr-monitoring
- Install Prometheus
helm install dapr-prom stable/prometheus -n dapr-monitoring
If you are minikube user or want to disable persistent volume for development purpose, you can disable it by using the following command.
helm install prometheus stable/prometheus -n dapr-monitoring
--set alertmanager.persistentVolume.enable=false
--set pushgateway.persistentVolume.enabled=false
--set server.persistentVolume.enabled=false
- Install Grafana
helm install grafana stable/grafana -n dapr-monitoring
If you are minikube user or want to disable persistent volume for development purpose, you can disable it by using the following command.
helm install grafana stable/grafana -n dapr-monitoring --set persistence.enabled=false
- Validation
Ensure Prometheus and Grafana are running in your cluster.
kubectl get pods -n dapr-monitoring
NAME                                                READY   STATUS    RESTARTS   AGE
dapr-prom-kube-state-metrics-9849d6cc6-t94p8        1/1     Running   0          4m58s
dapr-prom-prometheus-alertmanager-749cc46f6-9b5t8   2/2     Running   0          4m58s
dapr-prom-prometheus-node-exporter-5jh8p            1/1     Running   0          4m58s
dapr-prom-prometheus-node-exporter-88gbg            1/1     Running   0          4m58s
dapr-prom-prometheus-node-exporter-bjp9f            1/1     Running   0          4m58s
dapr-prom-prometheus-pushgateway-688665d597-h4xx2   1/1     Running   0          4m58s
dapr-prom-prometheus-server-694fd8d7c-q5d59         2/2     Running   0          4m58s
grafana-c49889cff-x56vj                             1/1     Running   0          5m10s
View metrics
- Port-forward to svc/grafana
$ kubectl port-forward svc/grafana 8080:80 -n dapr-monitoring
Forwarding from 127.0.0.1:8080 -> 3000
Forwarding from [::1]:8080 -> 3000
Handling connection for 8080
Handling connection for 8080
-
Browse
http://localhost:8080 -
Click Configuration Settings -> Data Sources

-
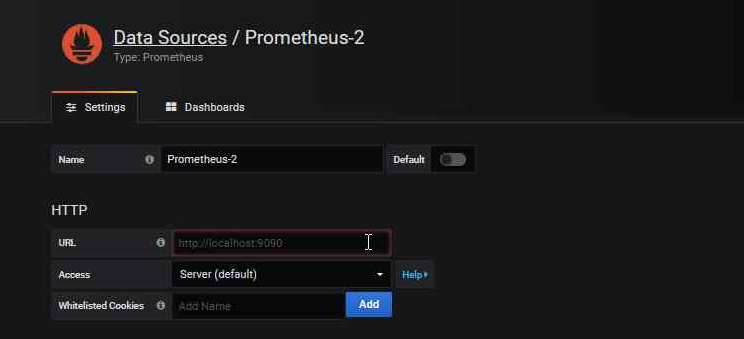
Add Prometheus as a data soruce.
-
Enter Promethesus server address in your cluster.
You can get the prometheus server address by running following command.
kubectl get svc -n dapr-monitoring
NAME                                 TYPE        CLUSTER-IP     EXTERNAL-IP   PORT(S)             AGE
dapr-prom-kube-state-metrics         ClusterIP   10.0.174.177   <none>        8080/TCP            7d9h
dapr-prom-prometheus-alertmanager    ClusterIP   10.0.255.199   <none>        80/TCP              7d9h
dapr-prom-prometheus-node-exporter   ClusterIP   None           <none>        9100/TCP            7d9h
dapr-prom-prometheus-pushgateway     ClusterIP   10.0.190.59    <none>        9091/TCP            7d9h
dapr-prom-prometheus-server          ClusterIP   10.0.172.191   <none>        80/TCP              7d9h
elasticsearch-master                 ClusterIP   10.0.36.146    <none>        9200/TCP,9300/TCP   7d10h
elasticsearch-master-headless        ClusterIP   None           <none>        9200/TCP,9300/TCP   7d10h
grafana                              ClusterIP   10.0.15.229    <none>        80/TCP              5d5h
kibana-kibana                        ClusterIP   10.0.188.224   <none>        5601/TCP            7d10h
In this set up tutorial, the server is dapr-prom-prometheus-server.
So you need to provide http://dapr-prom-prometheus-server.dapr-monitoring in the URL field.
-
Click Save & Test button to verify that connected succeeded.
-
Import Dapr dashboards.
You can now import built-in Grafana dashboard templates.
Refer here for details.

You can find screenshots of Dapr dashboards here.