mirror of https://github.com/fluxcd/flagger.git
364 lines
12 KiB
Markdown
364 lines
12 KiB
Markdown
# Open Service Mesh Canary Deployments
|
|
|
|
This guide shows you how to use Open Service Mesh (OSM) and Flagger to automate canary deployments.
|
|
|
|
|
|
|
|
## Prerequisites
|
|
|
|
Flagger requires a Kubernetes cluster **v1.16** or newer and Open Service Mesh **0.9.1** or newer.
|
|
|
|
OSM must have permissive traffic policy enabled and have an instance of Prometheus for metrics.
|
|
|
|
- If the OSM CLI is being used for installation, install OSM using the following command:
|
|
```bash
|
|
osm install \
|
|
--set=OpenServiceMesh.deployPrometheus=true \
|
|
--set=OpenServiceMesh.enablePermissiveTrafficPolicy=true
|
|
```
|
|
- If a managed instance of OSM is being used:
|
|
- [Bring your own instance](docs.openservicemesh.io/docs/guides/observability/metrics/#byo-prometheus) of Prometheus,
|
|
setting the namespace to match the managed OSM controller namespace
|
|
- Enable permissive traffic policy after installation by updating the OSM MeshConfig resource:
|
|
```bash
|
|
# Replace <osm-namespace> with OSM controller's namespace
|
|
kubectl patch meshconfig osm-mesh-config -n <osm-namespace> -p '{"spec":{"traffic":{"enablePermissiveTrafficPolicyMode":true}}}' --type=merge
|
|
```
|
|
|
|
To install Flagger in the default `osm-system` namespace, use:
|
|
```bash
|
|
kubectl apply -k https://github.com/fluxcd/flagger//kustomize/osm?ref=main
|
|
```
|
|
|
|
Alternatively, if a non-default namespace or managed instance of OSM is in use, install Flagger with Helm, replacing the <osm-namespace>
|
|
values as appropriate. If a custom instance of Prometheus is being used, replace `osm-prometheus` with the relevant Prometheus service name.
|
|
```bash
|
|
helm upgrade -i flagger flagger/flagger \
|
|
--namespace=<osm-namespace> \
|
|
--set meshProvider=osm \
|
|
--set metricsServer=http://osm-prometheus.<osm-namespace>.svc:7070
|
|
```
|
|
|
|
## Bootstrap
|
|
|
|
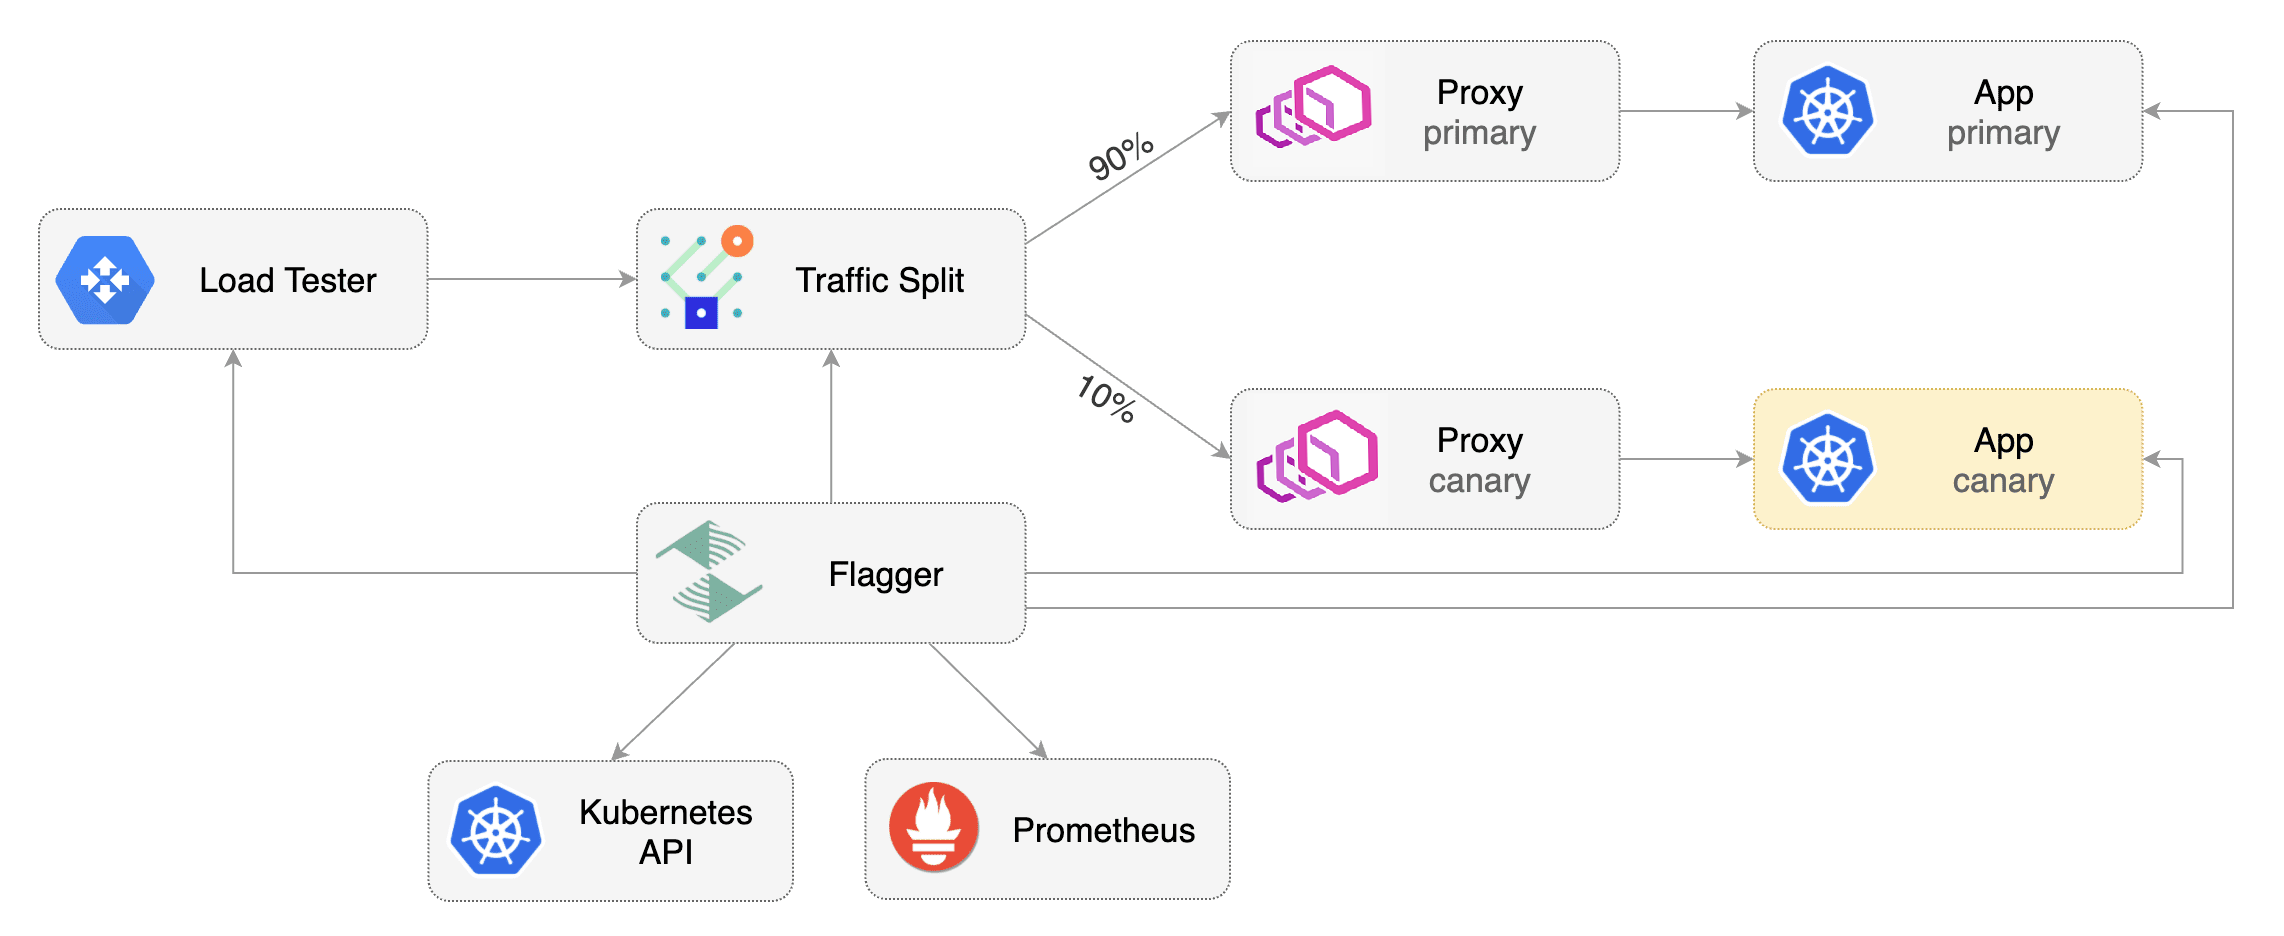
Flagger takes a Kubernetes deployment and optionally a horizontal pod autoscaler (HPA),
|
|
then creates a series of objects (Kubernetes deployments, ClusterIP services and SMI traffic split).
|
|
These objects expose the application inside the mesh and drive the canary analysis and promotion.
|
|
|
|
Create a `test` namespace and enable OSM namespace monitoring and metrics scraping for the namespace.
|
|
|
|
```bash
|
|
kubectl create namespace test
|
|
osm namespace add test
|
|
osm metrics enable --namespace test
|
|
```
|
|
|
|
Create a `podinfo` deployment and a horizontal pod autoscaler:
|
|
|
|
```bash
|
|
kubectl apply -k https://github.com/fluxcd/flagger//kustomize/podinfo?ref=main
|
|
```
|
|
|
|
Install the load testing service to generate traffic during the canary analysis:
|
|
|
|
```bash
|
|
kubectl apply -k https://github.com/fluxcd/flagger//kustomize/tester?ref=main
|
|
```
|
|
|
|
Create a canary custom resource for the `podinfo` deployment.
|
|
The following `podinfo` canary custom resource instructs Flagger to:
|
|
1. monitor any changes to the `podinfo` deployment created earlier,
|
|
2. detect `podinfo` deployment revision changes, and
|
|
3. start a Flagger canary analysis, rollout, and promotion if there were deployment revision changes.
|
|
|
|
```yaml
|
|
apiVersion: flagger.app/v1beta1
|
|
kind: Canary
|
|
metadata:
|
|
name: podinfo
|
|
namespace: test
|
|
spec:
|
|
provider: osm
|
|
# deployment reference
|
|
targetRef:
|
|
apiVersion: apps/v1
|
|
kind: Deployment
|
|
name: podinfo
|
|
# HPA reference (optional)
|
|
autoscalerRef:
|
|
apiVersion: autoscaling/v2
|
|
kind: HorizontalPodAutoscaler
|
|
name: podinfo
|
|
# the maximum time in seconds for the canary deployment
|
|
# to make progress before it is rolled back (default 600s)
|
|
progressDeadlineSeconds: 60
|
|
service:
|
|
# ClusterIP port number
|
|
port: 9898
|
|
# container port number or name (optional)
|
|
targetPort: 9898
|
|
analysis:
|
|
# schedule interval (default 60s)
|
|
interval: 30s
|
|
# max number of failed metric checks before rollback
|
|
threshold: 5
|
|
# max traffic percentage routed to canary
|
|
# percentage (0-100)
|
|
maxWeight: 50
|
|
# canary increment step
|
|
# percentage (0-100)
|
|
stepWeight: 5
|
|
# OSM Prometheus checks
|
|
metrics:
|
|
- name: request-success-rate
|
|
# minimum req success rate (non 5xx responses)
|
|
# percentage (0-100)
|
|
thresholdRange:
|
|
min: 99
|
|
interval: 1m
|
|
- name: request-duration
|
|
# maximum req duration P99
|
|
# milliseconds
|
|
thresholdRange:
|
|
max: 500
|
|
interval: 30s
|
|
# testing (optional)
|
|
webhooks:
|
|
- name: acceptance-test
|
|
type: pre-rollout
|
|
url: http://flagger-loadtester.test/
|
|
timeout: 30s
|
|
metadata:
|
|
type: bash
|
|
cmd: "curl -sd 'test' http://podinfo-canary.test:9898/token | grep token"
|
|
- name: load-test
|
|
type: rollout
|
|
url: http://flagger-loadtester.test/
|
|
timeout: 5s
|
|
metadata:
|
|
cmd: "hey -z 2m -q 10 -c 2 http://podinfo-canary.test:9898/"
|
|
```
|
|
|
|
Save the above resource as podinfo-canary.yaml and then apply it:
|
|
|
|
```bash
|
|
kubectl apply -f ./podinfo-canary.yaml
|
|
```
|
|
|
|
When the canary analysis starts, Flagger will call the pre-rollout webhooks before routing traffic to the canary.
|
|
The canary analysis will run for five minutes while validating the HTTP metrics and rollout hooks every half a minute.
|
|
|
|
After a couple of seconds Flagger will create the canary objects.
|
|
|
|
```bash
|
|
# applied
|
|
deployment.apps/podinfo
|
|
horizontalpodautoscaler.autoscaling/podinfo
|
|
ingresses.extensions/podinfo
|
|
canary.flagger.app/podinfo
|
|
|
|
# generated
|
|
deployment.apps/podinfo-primary
|
|
horizontalpodautoscaler.autoscaling/podinfo-primary
|
|
service/podinfo
|
|
service/podinfo-canary
|
|
service/podinfo-primary
|
|
trafficsplits.split.smi-spec.io/podinfo
|
|
```
|
|
|
|
After the bootstrap, the `podinfo` deployment will be scaled to zero and the traffic to `podinfo.test` will be routed to the primary pods.
|
|
During the canary analysis, the `podinfo-canary.test` address can be used to target directly the canary pods.
|
|
|
|
## Automated Canary Promotion
|
|
|
|
Flagger implements a control loop that gradually shifts traffic to the canary while measuring key performance indicators like HTTP requests success rate, requests average duration and pod health.
|
|
Based on analysis of the KPIs a canary is promoted or aborted.
|
|
|
|

|
|
|
|
Trigger a canary deployment by updating the container image:
|
|
|
|
```bash
|
|
kubectl -n test set image deployment/podinfo \
|
|
podinfod=ghcr.io/stefanprodan/podinfo:6.0.1
|
|
```
|
|
|
|
Flagger detects that the deployment revision changed and starts a new rollout.
|
|
|
|
|
|
```text
|
|
kubectl -n test describe canary/podinfo
|
|
|
|
Status:
|
|
Canary Weight: 0
|
|
Failed Checks: 0
|
|
Phase: Succeeded
|
|
Events:
|
|
New revision detected! Scaling up podinfo.test
|
|
Waiting for podinfo.test rollout to finish: 0 of 1 updated replicas are available
|
|
Pre-rollout check acceptance-test passed
|
|
Advance podinfo.test canary weight 5
|
|
Advance podinfo.test canary weight 10
|
|
Advance podinfo.test canary weight 15
|
|
Advance podinfo.test canary weight 20
|
|
Advance podinfo.test canary weight 25
|
|
Waiting for podinfo.test rollout to finish: 1 of 2 updated replicas are available
|
|
Advance podinfo.test canary weight 30
|
|
Advance podinfo.test canary weight 35
|
|
Advance podinfo.test canary weight 40
|
|
Advance podinfo.test canary weight 45
|
|
Advance podinfo.test canary weight 50
|
|
Copying podinfo.test template spec to podinfo-primary.test
|
|
Waiting for podinfo-primary.test rollout to finish: 1 of 2 updated replicas are available
|
|
Promotion completed! Scaling down podinfo.test
|
|
```
|
|
|
|
**Note** that if you apply any new changes to the `podinfo` deployment during the canary analysis, Flagger will restart the analysis.
|
|
|
|
A canary deployment is triggered by changes in any of the following objects:
|
|
|
|
* Deployment PodSpec \(container image, command, ports, env, resources, etc\)
|
|
* ConfigMaps mounted as volumes or mapped to environment variables
|
|
* Secrets mounted as volumes or mapped to environment variables
|
|
|
|
You can monitor all canaries with:
|
|
|
|
```bash
|
|
watch kubectl get canaries --all-namespaces
|
|
|
|
NAMESPACE NAME STATUS WEIGHT LASTTRANSITIONTIME
|
|
test podinfo Progressing 15 2019-06-30T14:05:07Z
|
|
prod frontend Succeeded 0 2019-06-30T16:15:07Z
|
|
prod backend Failed 0 2019-06-30T17:05:07Z
|
|
```
|
|
|
|
## Automated Rollback
|
|
|
|
During the canary analysis you can generate HTTP 500 errors and high latency to test if Flagger pauses and rolls back the faulted version.
|
|
|
|
Trigger another canary deployment:
|
|
|
|
```bash
|
|
kubectl -n test set image deployment/podinfo \
|
|
podinfod=ghcr.io/stefanprodan/podinfo:6.0.2
|
|
```
|
|
|
|
Exec into the load tester pod with:
|
|
|
|
```bash
|
|
kubectl -n test exec -it flagger-loadtester-xx-xx sh
|
|
```
|
|
|
|
Repeatedly generate HTTP 500 errors until the `kubectl describe` output below shows canary rollout failure:
|
|
|
|
```bash
|
|
watch -n 0.1 curl http://podinfo-canary.test:9898/status/500
|
|
```
|
|
|
|
Repeatedly generate latency until canary rollout fails:
|
|
|
|
```bash
|
|
watch -n 0.1 curl http://podinfo-canary.test:9898/delay/1
|
|
```
|
|
|
|
When the number of failed checks reaches the canary analysis thresholds defined in the `podinfo` canary custom resource earlier, the traffic is routed back to the primary, the canary is scaled to zero and the rollout is marked as failed.
|
|
|
|
```text
|
|
kubectl -n test describe canary/podinfo
|
|
|
|
Status:
|
|
Canary Weight: 0
|
|
Failed Checks: 10
|
|
Phase: Failed
|
|
Events:
|
|
Starting canary analysis for podinfo.test
|
|
Pre-rollout check acceptance-test passed
|
|
Advance podinfo.test canary weight 5
|
|
Advance podinfo.test canary weight 10
|
|
Advance podinfo.test canary weight 15
|
|
Halt podinfo.test advancement success rate 69.17% < 99%
|
|
Halt podinfo.test advancement success rate 61.39% < 99%
|
|
Halt podinfo.test advancement success rate 55.06% < 99%
|
|
Halt podinfo.test advancement request duration 1.20s > 0.5s
|
|
Halt podinfo.test advancement request duration 1.45s > 0.5s
|
|
Rolling back podinfo.test failed checks threshold reached 5
|
|
Canary failed! Scaling down podinfo.test
|
|
```
|
|
|
|
## Custom Metrics
|
|
|
|
The canary analysis can be extended with Prometheus queries.
|
|
|
|
Let's define a check for 404 not found errors.
|
|
Edit the canary analysis (`podinfo-canary.yaml` file) and add the following metric.
|
|
For more information on creating additional custom metrics using OSM metrics, please check the [metrics available in OSM](https://docs.openservicemesh.io/docs/guides/observability/metrics/#available-metrics).
|
|
|
|
```yaml
|
|
analysis:
|
|
metrics:
|
|
- name: "404s percentage"
|
|
threshold: 3
|
|
query: |
|
|
100 - (
|
|
sum(
|
|
rate(
|
|
osm_request_total{
|
|
destination_namespace="test",
|
|
destination_kind="Deployment",
|
|
destination_name="podinfo",
|
|
response_code!="404"
|
|
}[1m]
|
|
)
|
|
)
|
|
/
|
|
sum(
|
|
rate(
|
|
osm_request_total{
|
|
destination_namespace="test",
|
|
destination_kind="Deployment",
|
|
destination_name="podinfo"
|
|
}[1m]
|
|
)
|
|
) * 100
|
|
)
|
|
```
|
|
|
|
The above configuration validates the canary version by checking if the HTTP 404 req/sec percentage is below three percent of the total traffic.
|
|
If the 404s rate reaches the 3% threshold, then the analysis is aborted and the canary is marked as failed.
|
|
|
|
Trigger a canary deployment by updating the container image:
|
|
|
|
```bash
|
|
kubectl -n test set image deployment/podinfo \
|
|
podinfod=ghcr.io/stefanprodan/podinfo:6.0.3
|
|
```
|
|
|
|
Exec into the load tester pod with:
|
|
|
|
```bash
|
|
kubectl -n test exec -it flagger-loadtester-xx-xx sh
|
|
```
|
|
|
|
Repeatedly generate 404s until canary rollout fails:
|
|
|
|
```bash
|
|
watch -n 0.1 curl http://podinfo-canary.test:9898/status/404
|
|
```
|
|
|
|
Watch Flagger logs to confirm successful canary rollback.
|
|
|
|
```text
|
|
kubectl -n osm-system logs deployment/flagger -f | jq .msg
|
|
|
|
Starting canary deployment for podinfo.test
|
|
Pre-rollout check acceptance-test passed
|
|
Advance podinfo.test canary weight 5
|
|
Halt podinfo.test advancement 404s percentage 6.20 > 3
|
|
Halt podinfo.test advancement 404s percentage 6.45 > 3
|
|
Halt podinfo.test advancement 404s percentage 7.22 > 3
|
|
Halt podinfo.test advancement 404s percentage 6.50 > 3
|
|
Halt podinfo.test advancement 404s percentage 6.34 > 3
|
|
Rolling back podinfo.test failed checks threshold reached 5
|
|
Canary failed! Scaling down podinfo.test
|
|
```
|