mirror of https://github.com/fluxcd/flagger.git
125 lines
3.9 KiB
Markdown
125 lines
3.9 KiB
Markdown
# Monitoring
|
|
|
|
## Grafana
|
|
|
|
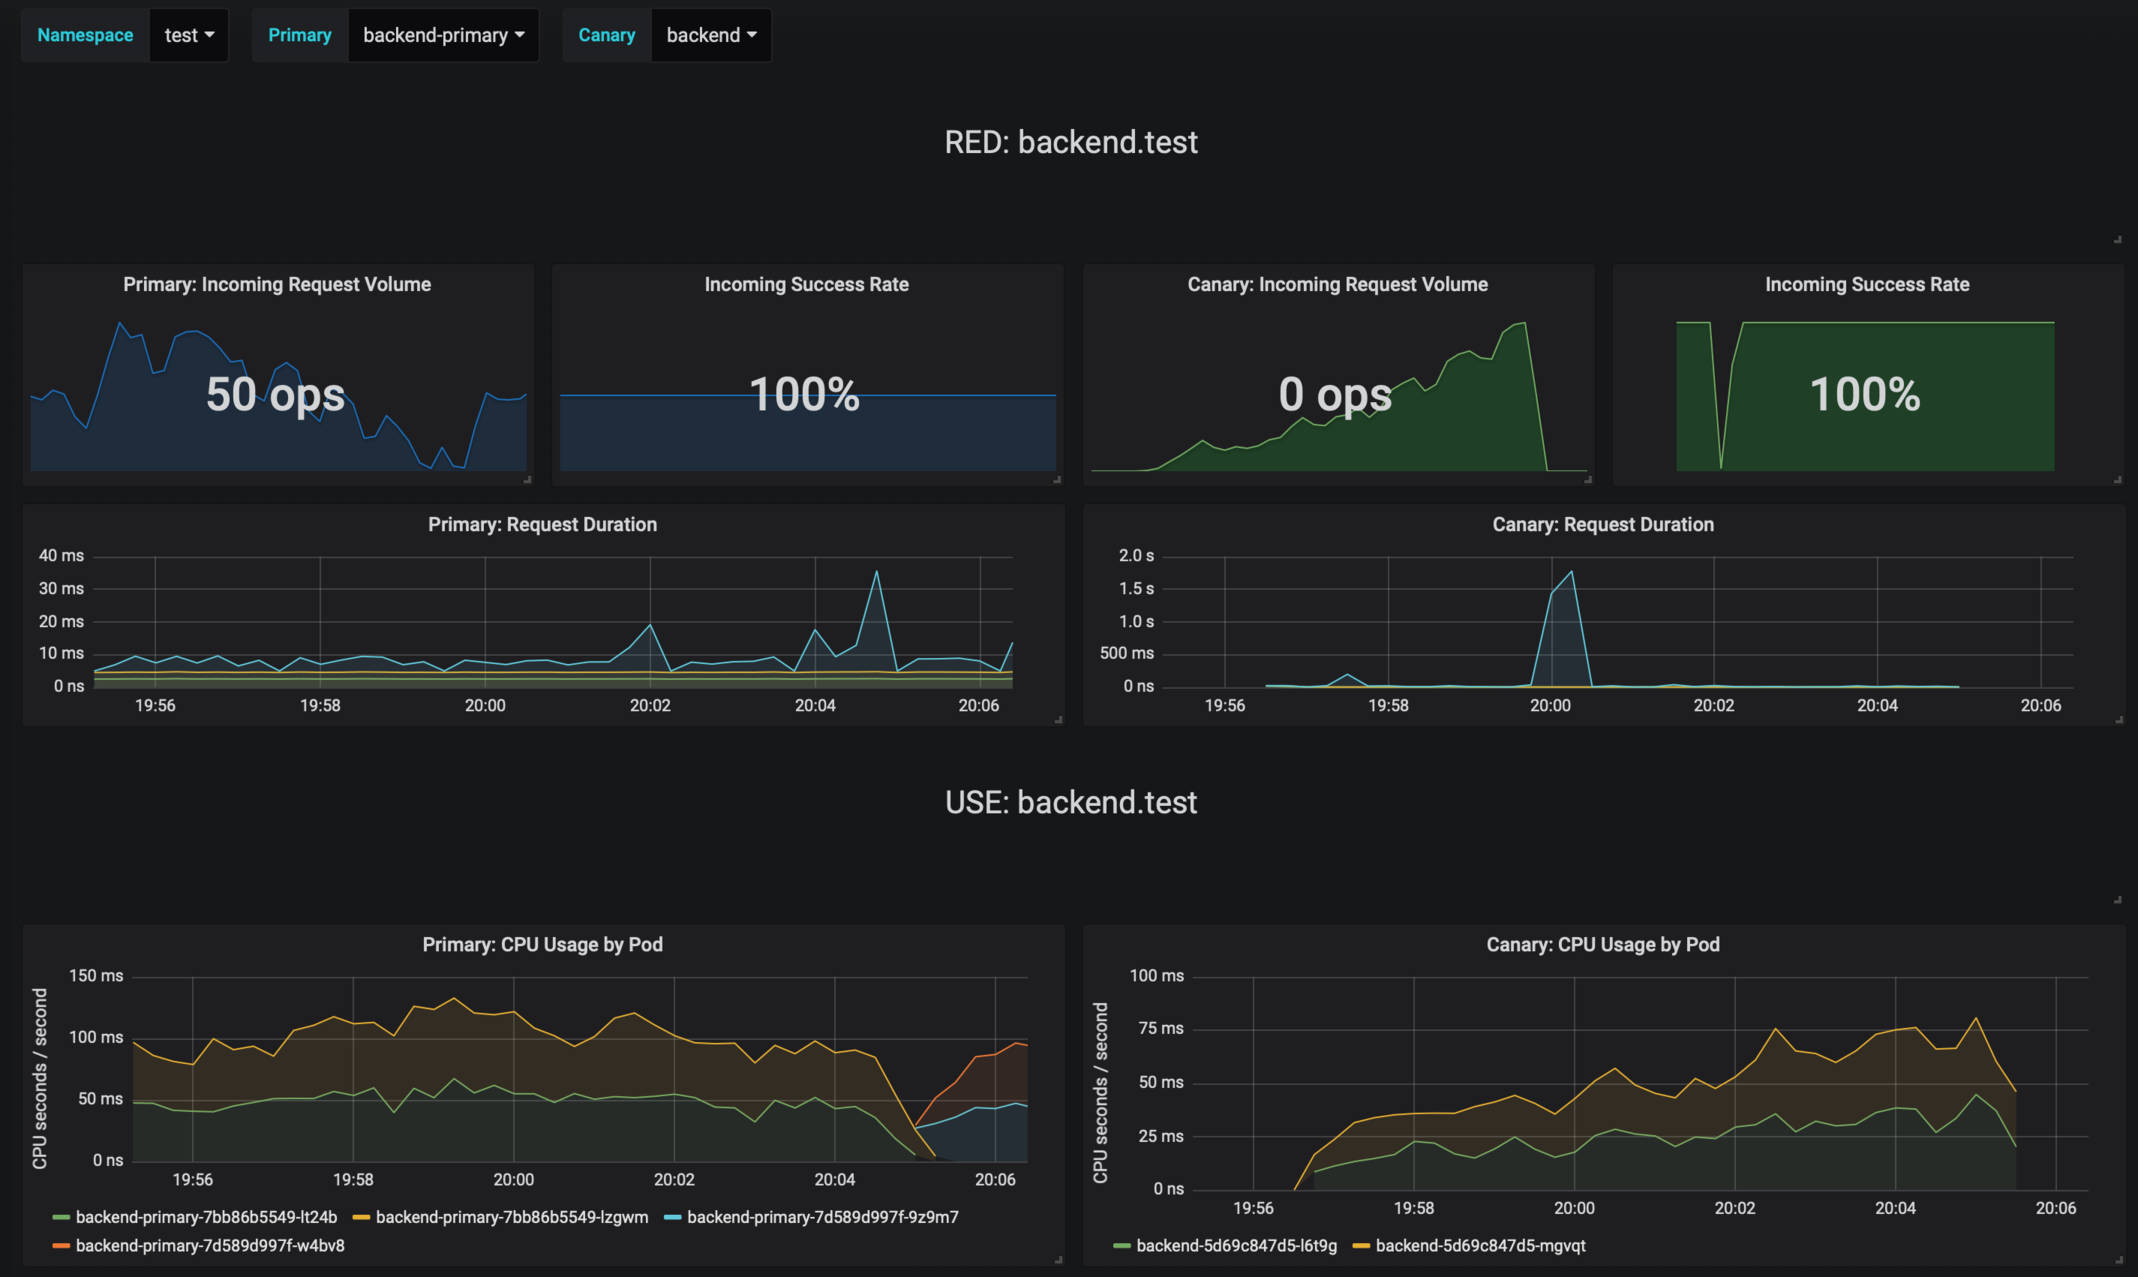
Flagger comes with a Grafana dashboard made for canary analysis. Install Grafana with Helm:
|
|
|
|
```bash
|
|
helm upgrade -i flagger-grafana flagger/grafana \
|
|
--set url=http://prometheus:9090
|
|
```
|
|
|
|
The dashboard shows the RED and USE metrics for the primary and canary workloads:
|
|
|
|
|
|
|
|
## Logging
|
|
|
|
The canary errors and latency spikes have been recorded as Kubernetes events and logged by Flagger in json format:
|
|
|
|
```text
|
|
kubectl -n istio-system logs deployment/flagger --tail=100 | jq .msg
|
|
|
|
Starting canary deployment for podinfo.test
|
|
Advance podinfo.test canary weight 5
|
|
Advance podinfo.test canary weight 10
|
|
Advance podinfo.test canary weight 15
|
|
Advance podinfo.test canary weight 20
|
|
Advance podinfo.test canary weight 25
|
|
Advance podinfo.test canary weight 30
|
|
Advance podinfo.test canary weight 35
|
|
Halt podinfo.test advancement success rate 98.69% < 99%
|
|
Advance podinfo.test canary weight 40
|
|
Halt podinfo.test advancement request duration 1.515s > 500ms
|
|
Advance podinfo.test canary weight 45
|
|
Advance podinfo.test canary weight 50
|
|
Copying podinfo.test template spec to podinfo-primary.test
|
|
Halt podinfo-primary.test advancement waiting for rollout to finish: 1 old replicas are pending termination
|
|
Scaling down podinfo.test
|
|
Promotion completed! podinfo.test
|
|
```
|
|
|
|
## Event Webhook
|
|
|
|
Flagger can be configured to send event payloads to a specified webhook:
|
|
|
|
```bash
|
|
helm upgrade -i flagger flagger/flagger \
|
|
--set eventWebhook=https://example.com/flagger-canary-event-webhook
|
|
```
|
|
|
|
The environment variable _EVENT\_WEBHOOK\_URL_ can be used for activating the event-webhook, too.
|
|
This is handy for using a secret to store a sensible value that could contain api keys for example.
|
|
|
|
When configured, every action that Flagger takes during a canary deployment
|
|
will be sent as JSON via an HTTP POST request. The JSON payload has the following schema:
|
|
|
|
```javascript
|
|
{
|
|
"name": "string (canary name)",
|
|
"namespace": "string (canary namespace)",
|
|
"phase": "string (canary phase)",
|
|
"metadata": {
|
|
"eventMessage": "string (canary event message)",
|
|
"eventType": "string (canary event type)",
|
|
"timestamp": "string (unix timestamp ms)"
|
|
}
|
|
}
|
|
```
|
|
|
|
Example:
|
|
|
|
```javascript
|
|
{
|
|
"name": "podinfo",
|
|
"namespace": "default",
|
|
"phase": "Progressing",
|
|
"metadata": {
|
|
"eventMessage": "New revision detected! Scaling up podinfo.default",
|
|
"eventType": "Normal",
|
|
"timestamp": "1578607635167"
|
|
}
|
|
}
|
|
```
|
|
|
|
The event webhook can be overwritten at canary level with:
|
|
|
|
```yaml
|
|
analysis:
|
|
webhooks:
|
|
- name: "send to Slack"
|
|
type: event
|
|
url: http://event-recevier.notifications/slack
|
|
```
|
|
|
|
## Metrics
|
|
|
|
Flagger exposes Prometheus metrics that can be used to determine
|
|
the canary analysis status and the destination weight values:
|
|
|
|
```bash
|
|
# Flagger version and mesh provider gauge
|
|
flagger_info{version="0.10.0", mesh_provider="istio"} 1
|
|
|
|
# Canaries total gauge
|
|
flagger_canary_total{namespace="test"} 1
|
|
|
|
# Canary promotion last known status gauge
|
|
# 0 - running, 1 - successful, 2 - failed
|
|
flagger_canary_status{name="podinfo" namespace="test"} 1
|
|
|
|
# Canary traffic weight gauge
|
|
flagger_canary_weight{workload="podinfo-primary" namespace="test"} 95
|
|
flagger_canary_weight{workload="podinfo" namespace="test"} 5
|
|
|
|
# Seconds spent performing canary analysis histogram
|
|
flagger_canary_duration_seconds_bucket{name="podinfo",namespace="test",le="10"} 6
|
|
flagger_canary_duration_seconds_bucket{name="podinfo",namespace="test",le="+Inf"} 6
|
|
flagger_canary_duration_seconds_sum{name="podinfo",namespace="test"} 17.3561329
|
|
flagger_canary_duration_seconds_count{name="podinfo",namespace="test"} 6
|
|
|
|
# Last canary metric analysis result per different metrics
|
|
flagger_canary_metric_analysis{metric="podinfo-http-successful-rate",name="podinfo",namespace="test"} 1
|
|
flagger_canary_metric_analysis{metric="podinfo-custom-metric",name="podinfo",namespace="test"} 0.918223108974359
|
|
```
|