10 KiB
Crossover Canary Deployments
This guide shows you how to use Envoy, Crossover and Flagger to automate canary deployments.
Crossover is a minimal Envoy xDS implementation supports Service Mesh Interface.
Prerequisites
Flagger requires a Kubernetes cluster v1.11 or newer and Envoy paired with Crossover sidecar.
Create a test namespace:
kubectl create ns test
Install Envoy along with the Crossover sidecar with Helm:
helm repo add crossover https://mumoshu.github.io/crossover

helm upgrade --install envoy crossover/envoy \
  --namespace test \
  -f <(cat <<EOF
smi:
  apiVersions:
    trafficSplits: v1alpha1
upstreams:
  podinfo:
    smi:
      enabled: true
    backends:
      podinfo-primary:
        port: 9898
        weight: 100
      podinfo-canary:
        port: 9898
        weight: 0
EOF
)
Install Flagger and the Prometheus add-on in the same namespace as Envoy:
helm repo add flagger https://flagger.app

helm upgrade -i flagger flagger/flagger \
--namespace test \
--set prometheus.install=true \
--set meshProvider=smi:crossover
Bootstrap
Flagger takes a Kubernetes deployment and optionally a horizontal pod autoscaler (HPA), then creates a series of objects (Kubernetes deployments, ClusterIP services, SMI traffic splits). These objects expose the application on the mesh and drive the canary analysis and promotion. There's no SMI object you need to create by yourself.
Create a deployment and a horizontal pod autoscaler:
kubectl apply -k github.com/weaveworks/flagger//kustomize/podinfo
Deploy the load testing service to generate traffic during the canary analysis:
helm upgrade -i flagger-loadtester flagger/loadtester \
--namespace=test
Create a metric template to measure the HTTP requests error rate:
apiVersion: flagger.app/v1beta1
kind: MetricTemplate
metadata:
  name: error-rate
  namespace: test
spec:
  provider:
    address: http://flagger-prometheus:9090
    type: prometheus
  query: |
    100 - rate(
      envoy_cluster_upstream_rq{
        kubernetes_namespace="{{ namespace }}",
        envoy_cluster_name="{{ target }}-canary",
        envoy_response_code!~"5.*"
      }[{{ interval }}])
    /
    rate(
      envoy_cluster_upstream_rq{
        kubernetes_namespace="{{ namespace }}",
        envoy_cluster_name="{{ target }}-canary"
      }[{{ interval }}]
    ) * 100
Create a metric template to measure the HTTP requests average duration:
apiVersion: flagger.app/v1beta1
kind: MetricTemplate
metadata:
  name: latency
  namespace: test
spec:
  provider:
    address: http://flagger-prometheus:9090
    type: prometheus
  query: |
    histogram_quantile(0.99,
      sum(
        rate(
          envoy_cluster_upstream_rq_time_bucket{
            kubernetes_namespace="{{ namespace }}",
            envoy_cluster_name="{{ target }}-canary"
          }[{{ interval }}]
        )
      ) by (le)
    )
Create a canary custom resource:
apiVersion: flagger.app/v1beta1
kind: Canary
metadata:
  name: podinfo
  namespace: test
spec:
  provider: "smi:crossover"
  # deployment reference
  targetRef:
    apiVersion: apps/v1
    kind: Deployment
    name: podinfo
  progressDeadlineSeconds: 60
  # HPA reference (optional)
  autoscalerRef:
    apiVersion: autoscaling/v2beta1
    kind: HorizontalPodAutoscaler
    name: podinfo
  service:
    port: 9898
  # define the canary analysis timing and KPIs
  analysis:
    # schedule interval (default 60s)
    interval: 1m
    # max number of failed metric checks before rollback
    threshold: 5
    # max traffic percentage routed to canary
    # percentage (0-100)
    maxWeight: 50
    # canary increment step
    # percentage (0-100)
    stepWeight: 5
    metrics:
    - name: error-rate
      templateRef:
        name: error-rate
      thresholdRange:
        max: 1
      interval: 30s
    - name: latency
      templateRef:
        name: latency
      thresholdRange:
        max: 0.5
      interval: 30s
    webhooks:
    - name: acceptance-test
      type: pre-rollout
      url: http://flagger-loadtester.test/
      timeout: 30s
      metadata:
        type: bash
        cmd: "curl -sd 'test' http://podinfo-canary.test:9898/token | grep token"
    - name: load-test
      url: http://flagger-loadtester.test/
      timeout: 5s
      metadata:
        cmd: "hey -z 1m -q 10 -c 2 -H 'Host: podinfo.test' http://envoy.test:10000/"
Save the above resource as podinfo-canary.yaml and then apply it:
kubectl apply -f ./podinfo-canary.yaml
After a couple of seconds Flagger will create the canary objects:
# applied
deployment.apps/podinfo
horizontalpodautoscaler.autoscaling/podinfo
canary.flagger.app/podinfo

# generated
deployment.apps/podinfo-primary
horizontalpodautoscaler.autoscaling/podinfo-primary
service/podinfo
service/podinfo-canary
service/podinfo-primary
trafficsplits.split.smi-spec.io/podinfo
After the boostrap, the podinfo deployment will be scaled to zero and the traffic to podinfo.test
will be routed to the primary pods. During the canary analysis,
the podinfo-canary.test address can be used to target directly the canary pods.
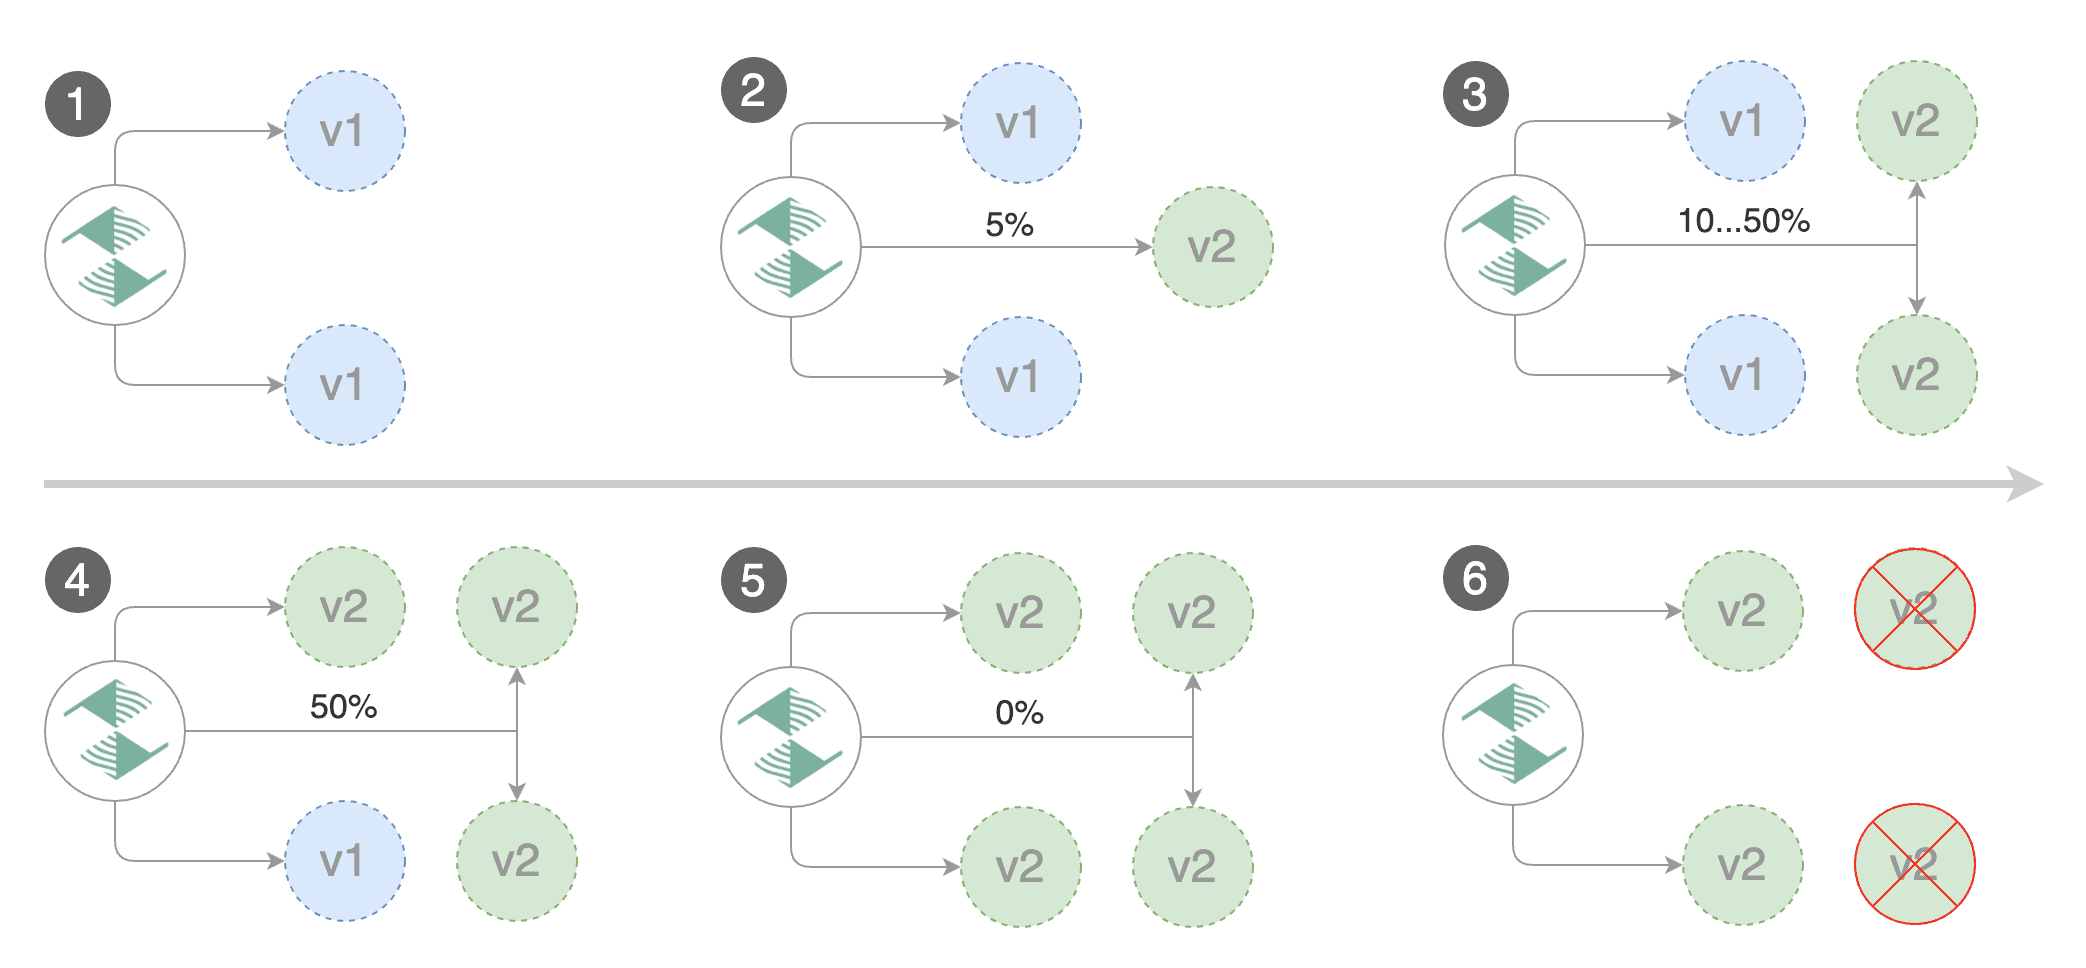
Automated canary promotion
Flagger implements a control loop that gradually shifts traffic to the canary while measuring key performance indicators like HTTP requests success rate, requests average duration and pod health. Based on analysis of the KPIs a canary is promoted or aborted, and the analysis result is published to Slack.
A canary deployment is triggered by changes in any of the following objects:
- Deployment PodSpec (container image, command, ports, env, resources, etc)
- ConfigMaps and Secrets mounted as volumes or mapped to environment variables
Trigger a canary deployment by updating the container image:
kubectl -n test set image deployment/podinfo \
podinfod=stefanprodan/podinfo:3.1.5
Flagger detects that the deployment revision changed and starts a new rollout:
kubectl -n test describe canary/podinfo

Status:
  Canary Weight:         0
  Failed Checks:         0
  Phase:                 Succeeded
Events:
 New revision detected! Scaling up podinfo.test
 Waiting for podinfo.test rollout to finish: 0 of 1 updated replicas are available
 Pre-rollout check acceptance-test passed
 Advance podinfo.test canary weight 5
 Advance podinfo.test canary weight 10
 Advance podinfo.test canary weight 15
 Advance podinfo.test canary weight 20
 Advance podinfo.test canary weight 25
 Advance podinfo.test canary weight 30
 Advance podinfo.test canary weight 35
 Advance podinfo.test canary weight 40
 Advance podinfo.test canary weight 45
 Advance podinfo.test canary weight 50
 Copying podinfo.test template spec to podinfo-primary.test
 Waiting for podinfo-primary.test rollout to finish: 1 of 2 updated replicas are available
 Routing all traffic to primary
 Promotion completed! Scaling down podinfo.test
When the canary analysis starts, Flagger will call the pre-rollout webhooks before routing traffic to the canary.
Note that if you apply new changes to the deployment during the canary analysis, Flagger will restart the analysis.
During the analysis the canary’s progress can be monitored with Grafana.
Flagger comes with a Grafana dashboard made for canary analysis. Install Grafana with Helm:
helm upgrade -i flagger-grafana flagger/grafana \
--namespace=test \
--set url=http://flagger-prometheus:9090
Run:
kubectl port-forward --namespace test svc/flagger-grafana 3000:80
The Envoy dashboard URL is http://localhost:3000/d/flagger-envoy/envoy-canary?refresh=10s&orgId=1&var-namespace=test&var-target=podinfo

You can monitor all canaries with:
watch kubectl get canaries --all-namespaces

NAMESPACE   NAME      STATUS        WEIGHT   LASTTRANSITIONTIME
test        podinfo   Progressing   15       2019-10-02T14:05:07Z
prod        frontend  Succeeded     0        2019-10-02T16:15:07Z
prod        backend   Failed        0        2019-10-02T17:05:07Z
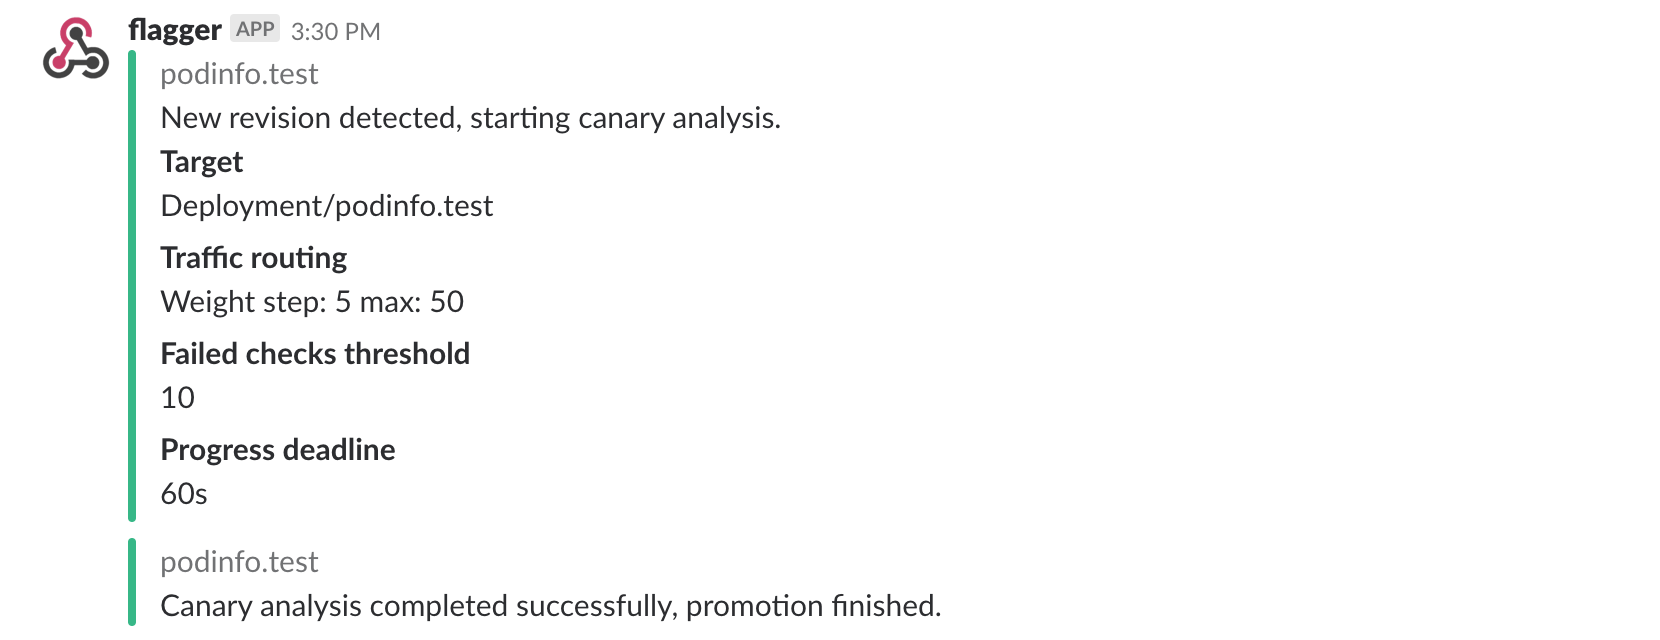
If you’ve enabled the Slack notifications, you should receive the following messages:
Automated rollback
During the canary analysis you can generate HTTP 500 errors or high latency to test if Flagger pauses the rollout.
Trigger a canary deployment:
kubectl -n test set image deployment/podinfo \
podinfod=stefanprodan/podinfo:3.1.2
Exec into the load tester pod with:
kubectl -n test exec -it deploy/flagger-loadtester bash
Generate HTTP 500 errors:
hey -z 1m -c 5 -q 5 -H 'Host: podinfo.test' http://envoy.test:10000/status/500
Generate latency:
watch -n 1 curl -H 'Host: podinfo.test' http://envoy.test:10000/delay/1
When the number of failed checks reaches the canary analysis threshold, the traffic is routed back to the primary, the canary is scaled to zero and the rollout is marked as failed.
kubectl -n test logs deploy/flagger -f | jq .msg

New revision detected! Starting canary analysis for podinfo.test
Pre-rollout check acceptance-test passed
Advance podinfo.test canary weight 5
Advance podinfo.test canary weight 10
Advance podinfo.test canary weight 15
Halt podinfo.test advancement success rate 69.17% < 99%
Halt podinfo.test advancement success rate 61.39% < 99%
Halt podinfo.test advancement success rate 55.06% < 99%
Halt podinfo.test advancement request duration 1.20s > 0.5s
Halt podinfo.test advancement request duration 1.45s > 0.5s
Rolling back podinfo.test failed checks threshold reached 5
Canary failed! Scaling down podinfo.test
If you’ve enabled the Slack notifications, you’ll receive a message if the progress deadline is exceeded, or if the analysis reached the maximum number of failed checks:
