mirror of https://github.com/fluxcd/flagger.git
4.5 KiB
4.5 KiB
| description |
|---|
| Automated canary deployments process |
How it works
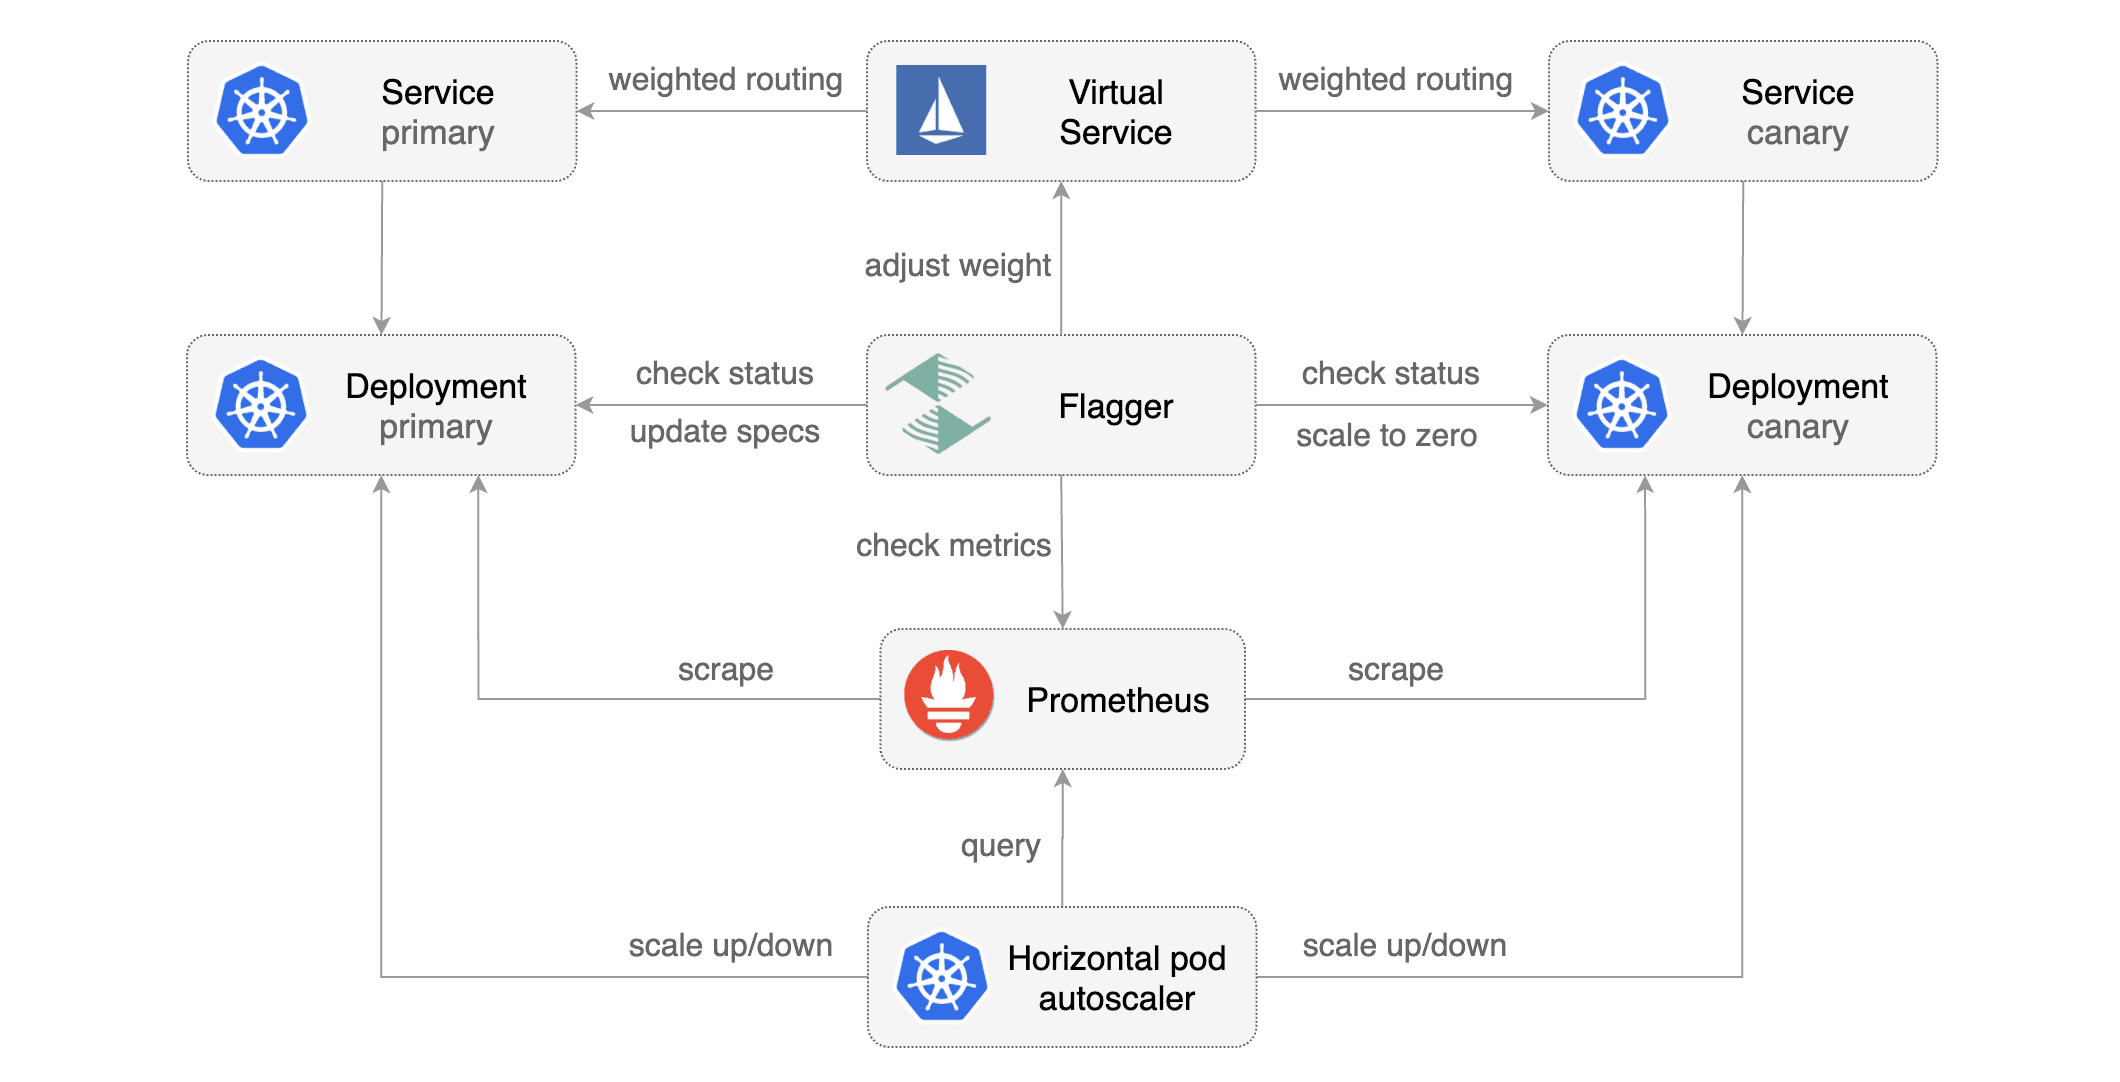
Flagger takes a Kubernetes deployment and optionally a horizontal pod autoscaler HPA and creates a series of objects Kubernetes deployments, ClusterIP services and Istio virtual services to drive the canary analysis and promotion.
Canary Custom Resource
For a deployment named podinfo, a canary promotion can be defined using Flagger's custom resource:
apiVersion: flagger.app/v1alpha1
kind: Canary
metadata:
  name: podinfo
  namespace: test
spec:
  # deployment reference
  targetRef:
    apiVersion: apps/v1
    kind: Deployment
    name: podinfo
  # the maximum time in seconds for the canary deployment
  # to make progress before it is rollback (default 600s)
  progressDeadlineSeconds: 60
  # hpa reference (optional)
  autoscalerRef:
    apiVersion: autoscaling/v2beta1
    kind: HorizontalPodAutoscaler
    name: podinfo
  service:
    # container port
    port: 9898
    # Istio gateways (optional)
    gateways:
    - public-gateway.istio-system.svc.cluster.local
    # Istio virtual service host names (optional)
    hosts:
    - app.istio.weavedx.com
  canaryAnalysis:
    # max number of failed metric checks before rollback
    threshold: 5
    # max traffic percentage routed to canary
    # percentage (0-100)
    maxWeight: 50
    # canary increment step
    # percentage (0-100)
    stepWeight: 10
    metrics:
    - name: istio_requests_total
      # minimum req success rate (non 5xx responses)
      # percentage (0-100)
      threshold: 99
      interval: 1m
    - name: istio_request_duration_seconds_bucket
      # maximum req duration P99
      # milliseconds
      threshold: 500
      interval: 30s
Canary Deployment
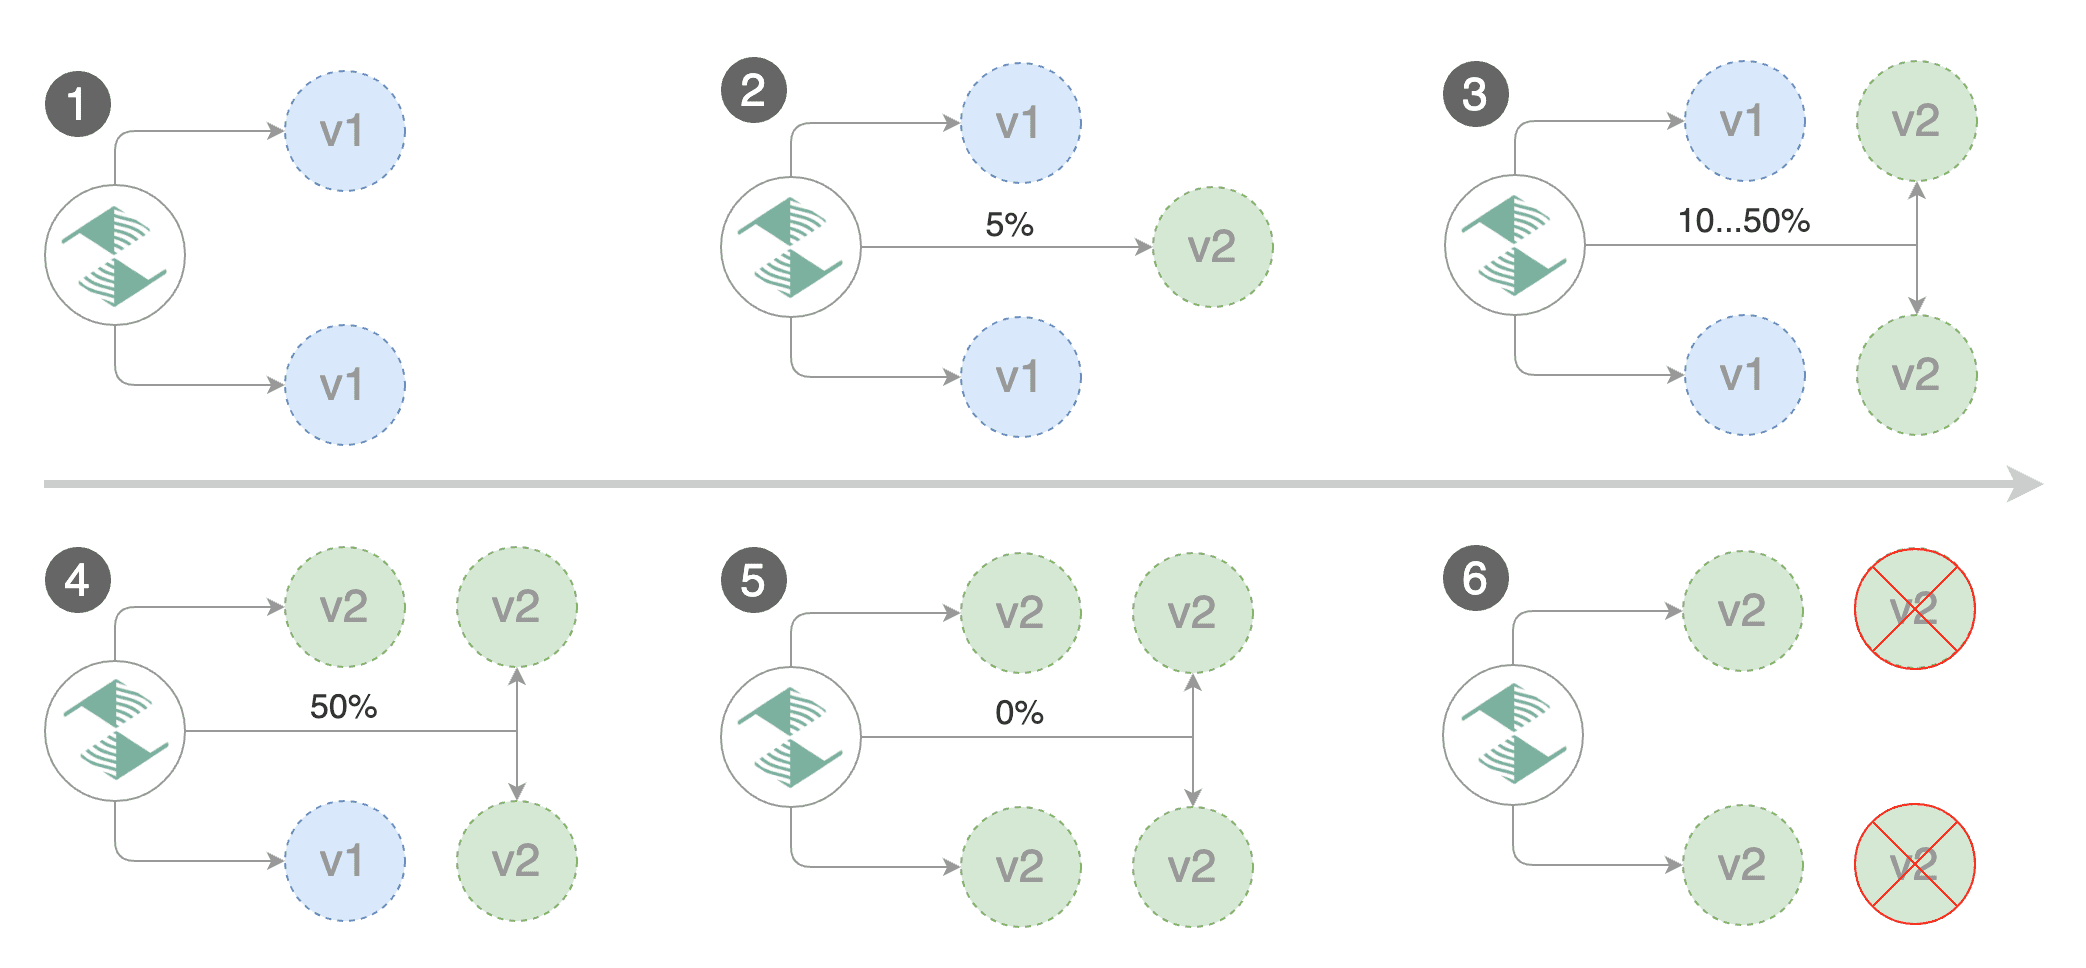
Gated canary promotion stages:
- scan for canary deployments
- creates the primary deployment if needed
- check Istio virtual service routes are mapped to primary and canary ClusterIP services
- check primary and canary deployments status
- halt advancement if a rolling update is underway
- halt advancement if pods are unhealthy
- increase canary traffic weight percentage from 0% to 5%
step weight - check canary HTTP request success rate and latency
- halt advancement if any metric is under the specified threshold
- increment the failed checks counter
- check if the number of failed checks reached the threshold
- route all traffic to primary
- scale to zero the canary deployment and mark it as failed
- wait for the canary deployment to be updated
revision bumpand start over
- increase canary traffic weight by 5%
step weighttill it reaches 50%max weight- halt advancement while canary request success rate is under the threshold
- halt advancement while canary request duration P99 is over the threshold
- halt advancement if the primary or canary deployment becomes unhealthy
- halt advancement while canary deployment is being scaled up/down by HPA
- promote canary to primary
- copy canary deployment spec template over primary
- wait for primary rolling update to finish
- halt advancement if pods are unhealthy
- route all traffic to primary
- scale to zero the canary deployment
- mark rollout as finished
- wait for the canary deployment to be updated
revision bumpand start over
You can change the canary analysis max weight and the step weight percentage in the Flagger's custom resource.
Canary Analisys
The canary analysis is using the following promql queries:
HTTP requests success rate percentage
sum(
    rate(
        istio_requests_total{
          reporter="destination",
          destination_workload_namespace=~"$namespace",
          destination_workload=~"$workload",
          response_code!~"5.*"
        }[$interval]
    )
)
/
sum(
    rate(
        istio_requests_total{
          reporter="destination",
          destination_workload_namespace=~"$namespace",
          destination_workload=~"$workload"
        }[$interval]
    )
)
HTTP requests milliseconds duration P99
histogram_quantile(0.99,
  sum(
    irate(
      istio_request_duration_seconds_bucket{
        reporter="destination",
        destination_workload=~"$workload",
        destination_workload_namespace=~"$namespace"
      }[$interval]
    )
  ) by (le)
)

