mirror of https://github.com/knative/docs.git
159 lines
7.2 KiB
Markdown
159 lines
7.2 KiB
Markdown
---
|
|
title: "Event-driven Image and BigQuery processing pipelines with Knative on
|
|
Google Cloud"
|
|
date: 2020-06-19
|
|
description: "Using Knative Eventing to build event-driven image and BigQuery
|
|
processing pipelines on Google Cloud"
|
|
type: "blog"
|
|
---
|
|
|
|
In this blog post, I will outline two event-driven processing pipelines that I
|
|
recently built with Knative Eventing. Along the way, I will explain event sources,
|
|
custom events and other components provided by Knative, that greatly simplify the
|
|
development of event-driven architectures.
|
|
|
|
Both of these pipelines are available on GitHub, including source code, configurations, and detailed
|
|
instructions, as part of my [Knative Tutorial](https://github.com/meteatamel/knative-tutorial).
|
|
|
|
## Knative components used
|
|
|
|
When creating these example pipelines, I relied on a few Knative components that greatly simplified
|
|
my development. More specifially:
|
|
|
|
1. [Event sources](https://knative.dev/docs/developer/eventing/sources/) allow you to
|
|
read external events in your cluster. [Knative-GCP
|
|
Sources](https://github.com/google/knative-gcp#knative-gcp-sources) provide a
|
|
number of eventing sources ready to read events from various Google Cloud
|
|
sources.
|
|
2. [Broker and triggers](https://knative.dev/docs/eventing/broker/) provide
|
|
event delivery without producers or consumers needing to know about how the
|
|
events are routed.
|
|
3. **Custom events and event replies**: In Knative, all events are
|
|
[CloudEvents](https://cloudevents.io/), so it's useful to have a standard format
|
|
for events and various SDKs to read/write them. Knative supports
|
|
custom events and event replies. Any service can receive an event, do some
|
|
processing, create a custom event with new data, and reply back to the broker
|
|
so that other services can read the custom event. This is useful in pipelines,
|
|
where each service does a little bit of work and passes the message forward to the next service.
|
|
|
|
## Image Processing Pipeline
|
|
|
|
In this image processing pipeline example, users upload an image to a storage
|
|
bucket on Google Cloud, process the image with a number of different Knative
|
|
services, and save the processed image to an output bucket.
|
|
|
|
I defined two requirements for the pipeline:
|
|
|
|
1. Uploaded images are filtered before they are sent
|
|
through the pipeline. For example, no adult themed or violent images are allowed.
|
|
2. The pipeline can contain any number of processing services that can be added or
|
|
removed as needed.
|
|
|
|
### Architecture
|
|
|
|
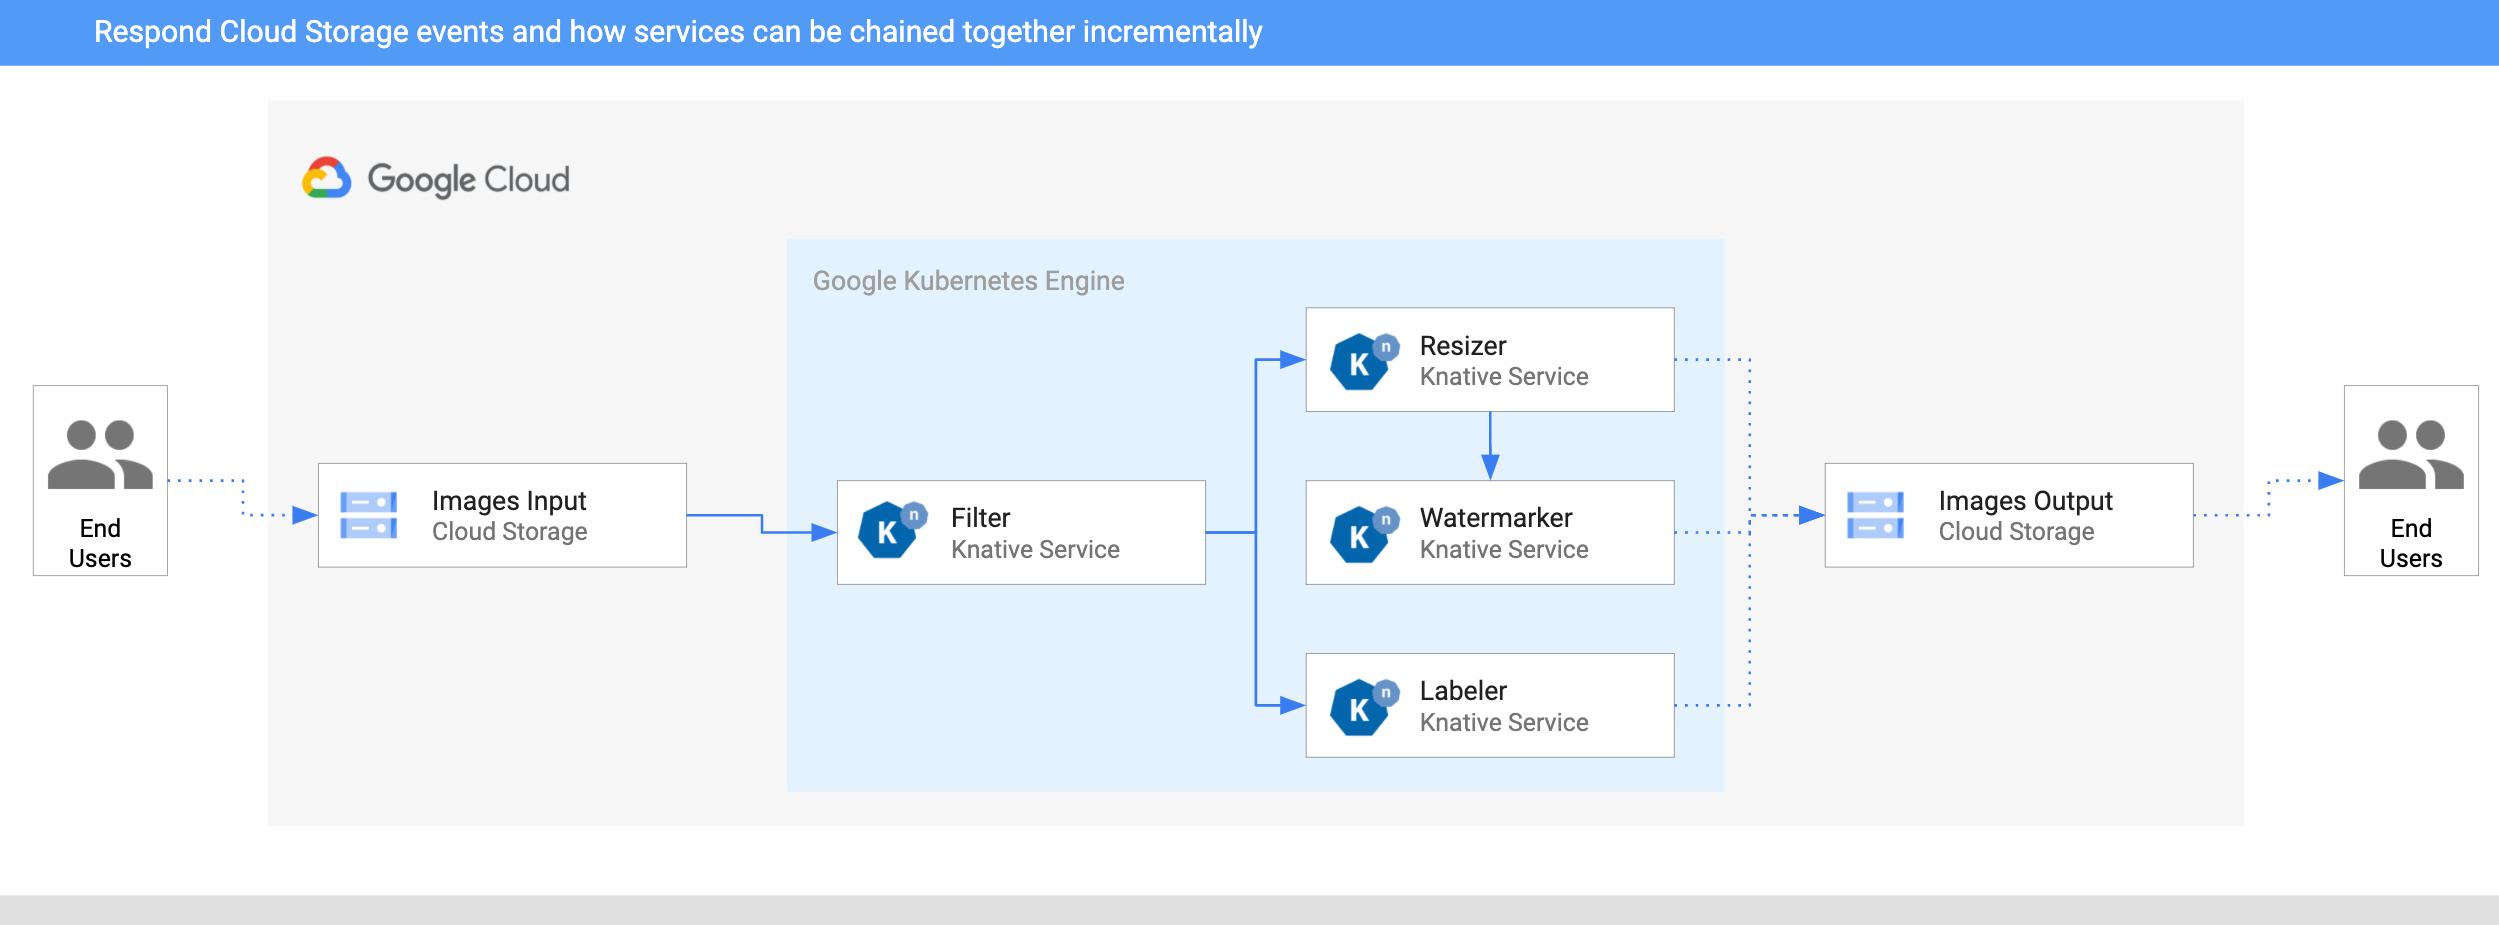
This section explains the architecture of the image processing pipeline. The pipeline is deployed to
|
|
Google Kubernetes Engine (GKE) on Google Cloud.
|
|
|
|
|
|
|
|
1. An image is saved to an input Cloud Storage bucket.
|
|
2. A Cloud Storage update event is read into Knative by
|
|
[CloudStorageSource](https://github.com/google/knative-gcp/blob/master/docs/examples/cloudstoragesource/README.md).
|
|
3. A filter service receives the Cloud Storage event. It uses the Vision API to
|
|
determine whether the image is safe or should be filtered. If the image is safe, the filter service creates a custom CloudEvent of
|
|
type `dev.knative.samples.fileuploaded` and passes it back to the broker.
|
|
4. The resizer service receives the `fileuploaded` event, and then resizes the image using the
|
|
[ImageSharp](https://github.com/SixLabors/ImageSharp) library. The service then saves the
|
|
resized image to the output bucket, creates a custom CloudEvent of type
|
|
`dev.knative.samples.fileresized`, and passes the event back to the broker.
|
|
5. The watermark service receives the `fileresized` event, adds a watermark to the
|
|
image using the [ImageSharp](https://github.com/SixLabors/ImageSharp) library, and
|
|
saves the image to the output bucket.
|
|
6. The labeler receives the `fileuploaded` event, extracts labels from the image using the
|
|
Vision API, and saves the labels to the output bucket.
|
|
|
|
### Test the pipeline
|
|
|
|
To test the pipeline, I uploaded a picture from my favorite beach,
|
|
Ipanema in Rio de Janeiro, to the bucket:
|
|
|
|

|
|
|
|
After a few seconds, I saw 3 files in my output bucket:
|
|
|
|
```sh
|
|
gsutil ls gs://knative-atamel-images-output
|
|
|
|
gs://knative-atamel-images-output/beach-400x400-watermark.jpeg
|
|
gs://knative-atamel-images-output/beach-400x400.png
|
|
gs://knative-atamel-images-output/beach-labels.txt
|
|
```
|
|
|
|
We can see the labels `Sky,Body of
|
|
water,Sea,Nature,Coast,Water,Sunset,Horizon,Cloud,Shore` in the text file, and
|
|
the resized and watermarked image:
|
|
|
|

|
|
|
|
## BigQuery Processing Pipeline
|
|
|
|
This pipeline example is a schedule driven pipeline, which queries
|
|
and finds the daily number of COVID-19 cases for the UK and Cyprus. I used a public COVID-19
|
|
dataset on BigQuery to get the data, generate charts, and send myself one
|
|
email for each country, once a day, containing those charts.
|
|
|
|
### Architecture
|
|
|
|
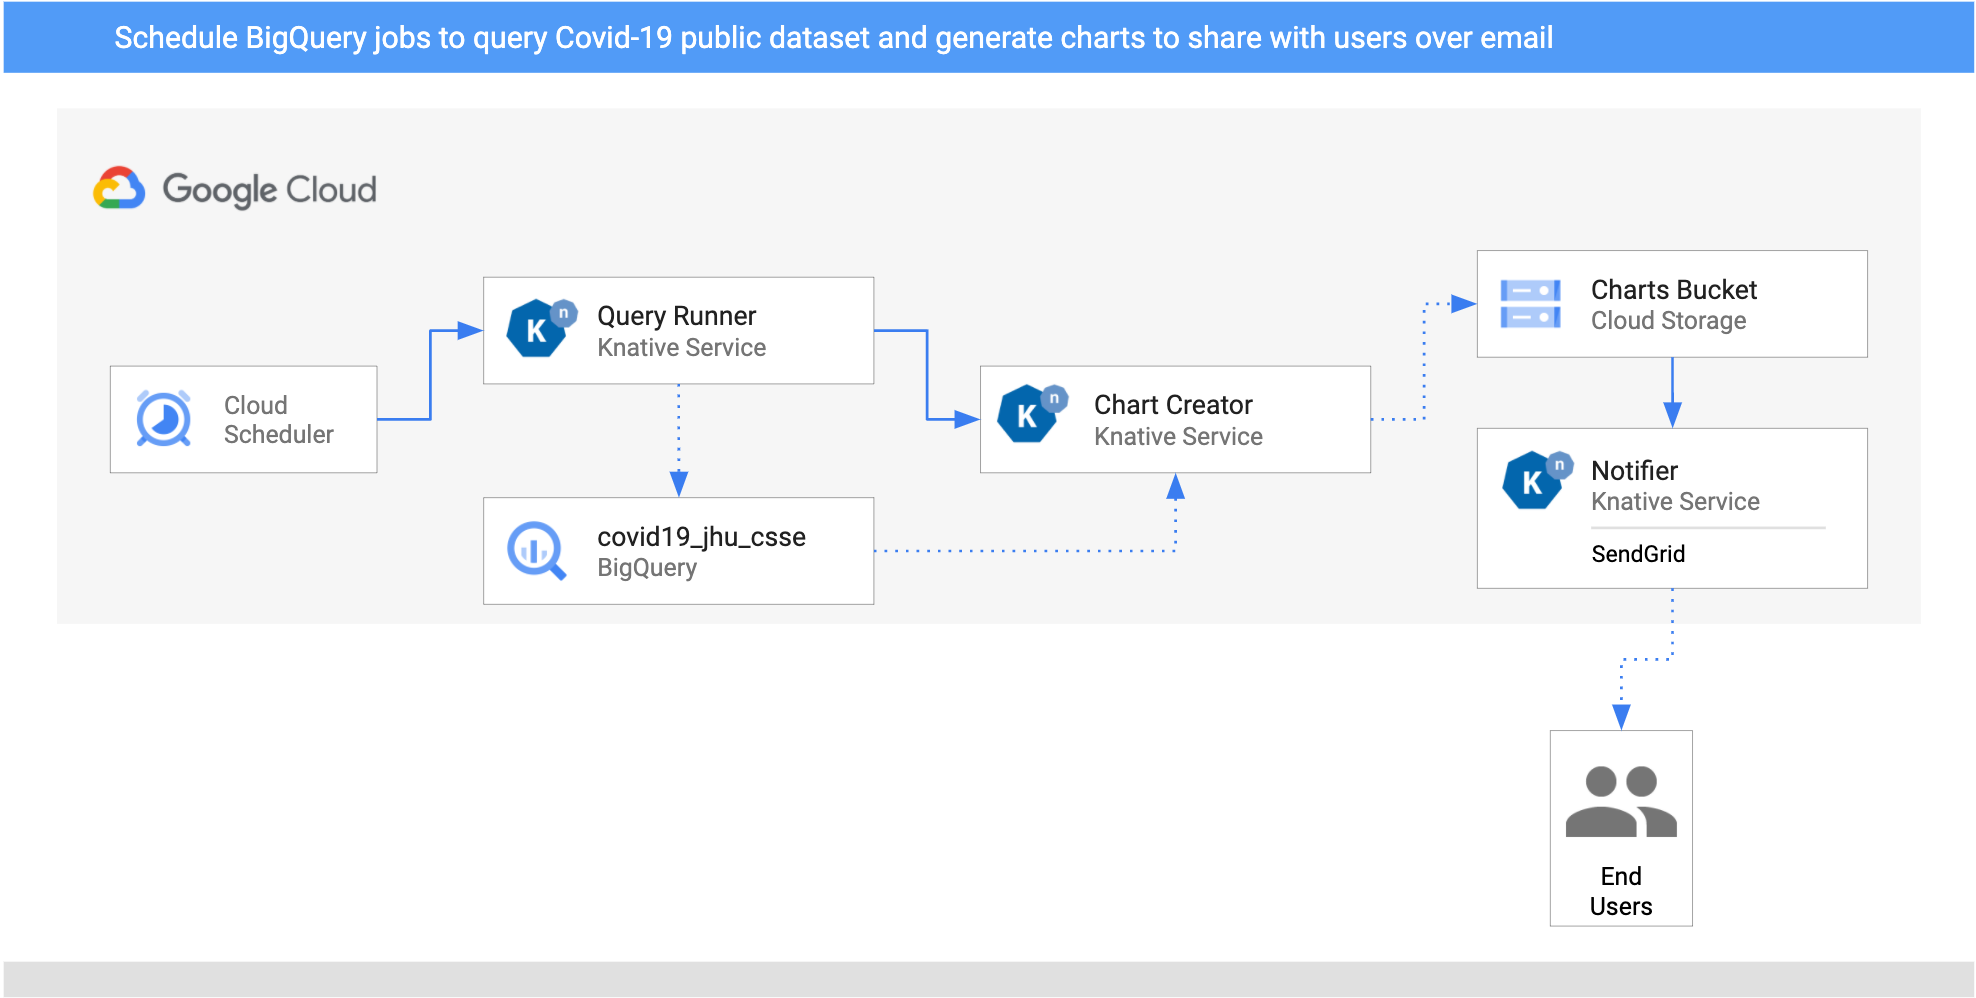
Here's the architecture of the pipeline.
|
|
|
|
|
|
|
|
1. I setup two `CloudSchedulerSources` for two countries (United Kingdom and
|
|
Cyprus) to call the `QueryRunner` service once a day.
|
|
2. The QueryRunner service receives the scheduler events for the UK and Cyprus,
|
|
queries COVID-19 cases for each of them using BigQuery's public
|
|
COVID-19 data set, and saves the results in a separate BigQuery table. After this is
|
|
done, the QueryRunner service returns a custom CloudEvent of type
|
|
`dev.knative.samples.querycompleted`.
|
|
3. The ChartCreator service receives the `querycompleted`
|
|
CloudEvent, creates a chart from BigQuery data using `Matplotlib`, and saves it to
|
|
a Cloud Storage bucket.
|
|
4. The notifier service is another receives the
|
|
`com.google.cloud.storage.object.finalize` CloudEvent from the bucket through a
|
|
CloudStorageSource, and sends an email notification to users using SendGrid.
|
|
|
|
### Test the pipeline
|
|
|
|
The CloudSchedulerSource creates CloudScheduler jobs:
|
|
|
|
```bash
|
|
gcloud scheduler jobs list
|
|
|
|
ID LOCATION SCHEDULE (TZ) TARGET_TYPE STATE
|
|
cre-scheduler-2bcb33d8-3165-4eca-9428-feb99bc320e2 europe-west1 0 16 * * * (UTC) Pub/Sub ENABLED
|
|
cre-scheduler-714c0b82-c441-42f4-8f99-0e2eac9a5869 europe-west1 0 17 * * * (UTC) Pub/Sub ENABLED
|
|
```
|
|
|
|
Trigger the jobs:
|
|
|
|
```bash
|
|
gcloud scheduler jobs run cre-scheduler-2bcb33d8-3165-4eca-9428-feb99bc320e2
|
|
```
|
|
|
|
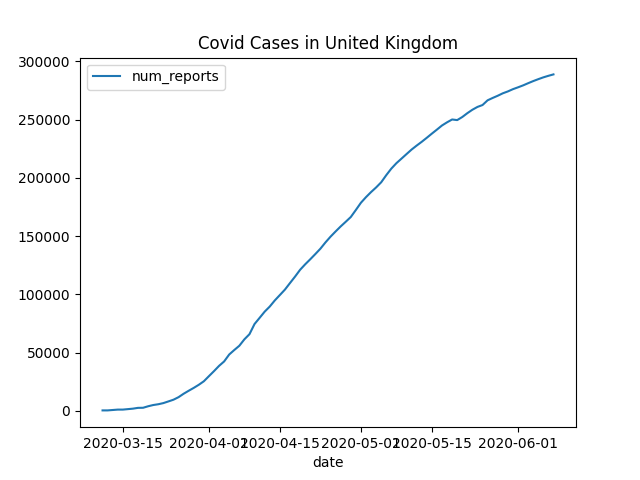
You should get an email with with a chart similar to this in a few minutes:
|
|
|
|
|
|
|
|
This wraps up my post. As I already mentioned, if you want more detailed instructions,
|
|
you can check out
|
|
[image-processing-pipeline](https://github.com/meteatamel/knative-tutorial/blob/master/docs/image-processing-pipeline.md)
|
|
and
|
|
[bigquery-processing-pipeline](https://github.com/meteatamel/knative-tutorial/blob/master/docs/bigquery-processing-pipeline.md)
|
|
as part of my [Knative Tutorial](https://github.com/meteatamel/knative-tutorial)
|
|
|
|
If you have questions/comments, feel free to reach out to me on Twitter [@meteatamel](https://twitter.com/meteatamel)).
|
|
|
|
---
|
|
|
|
By [Mete Atamel](https://twitter.com/meteatamel) - Developer Advocate, Google Cloud
|