15 KiB
| title | weight | description |
|---|---|---|
| Monitoring Kubernetes Health | 14 | Guidelines for finding and reporting failing tests in Kubernetes. |
Monitoring Kubernetes Health
Table of Contents
- Monitoring the health of Kubernetes with TestGrid
- What dashboards should I monitor?
- Test failures that block my Pull Request
- What do I do when I see a TestGrid alert?
- Communicate your findings
- Fill out the issue
- Iterate
Overview
This document describes the tools used to monitor CI jobs that check the correctness of changes made to core Kubernetes.
Monitoring the health of Kubernetes CI Jobs with TestGrid
TestGrid is a highly-configurable, interactive dashboard for viewing your test results in a grid. TestGrid's back end components are open sourced and can be viewed in the TestGrid repo The front-end code that renders the dashboard is not currently open sourced.
The Kubernetes community has its own TestGrid instance which we use to monitor and observe the health of the project.
Each Special Interest Group or SIG has its own set of dashboards. Each dashboard is composed of different jobs (build, unit test, integration test, end-to-end (e2e) test, etc.) These dashboards allow different teams to monitor and understand how their areas are doing.
End-to-End test (e2e) jobs are in turn made up of test stages (e.g., bootstrapping a Kubernetes cluster, tearing down a Kubernetes cluster) and e2e tests are organized hierarchically per Component and Subcategory within that component. e.g., the Kubectl client component tests have tests that describe the expected behavior of Kubectl logs, one of which is described as should be able to retrieve and filter logs.
This hierarchy is not currently reflected in TestGrid so a test row will contain a flattened name which concatenates all of these strings in to a single string.
We highly encourage SIGs to periodically monitor the dashboards related to the sub-projects that they own. If you see that a job or test has been failing, please raise an issue with the corresponding SIG in either their mailing list or in Slack.
In particular, we always welcome the following contributions:
Note: It is important that all SIGs periodically monitor their jobs and tests. Furthermore, if jobs or tests are failing or flaking, then pull requests will take a lot longer to be merged. For more information on how flaking tests disrupt PR merging and how to eliminate them see Flaky Tests
What dashboards should I monitor?
This depends on what areas of Kubernetes you want to contribute to. You should monitor the dashboards owned by the SIG you are working with.
Additionally, you should check:
since these jobs run tests that are used by SIG Release to determine the overall quality of Kubernetes and whether or not the commit on master can be considered suitable for release. Failing tests on a job in sig-release-master-blocking block a release from taking place.
If your contributions involve code for past releases of kubernetes (e.g. cherry-picks or backports), we recommend you periodically check on the blocking and informing dashboards for past releases
Pull request test failures caused by tests unrelated to your change
If a test fails on your Pull Request, and it's clearly not related to the code your wrote, this presents an opportunity to improve the signal delivered by CI.
Find any open issues that appear related (have the name of the test in them, describe a similar error, etc.). You can link the open issue in a comment you use to retrigger jobs, either calling the job out specifically:
./test pull-kubernetes-foo
https://github.com/kubernetes/kubernetes/issues/foo
or even if just invoking retest
./retest
https://github.com/kubernetes/kubernetes/issues/foo
(Note the . prefixes are so you don't actually trigger Prow)
You can back-link from the issue to your PR that encountered it, to bump the issue's last updated date.
When you do this you are adding evidence to support the need to fix the issue by documenting the pain contributors are experiencing.
What do I do when I see a TestGrid alert?
If you are part of a SIG's mailing list, occasionally you may see emails from TestGrid reporting that a job or a test has recently failed.
Alerts are also displayed on the Summary Page of TestGrid dashboards when you click on the Show All Alerts button at the top of the Summary or Show Alerts for an individual Job.
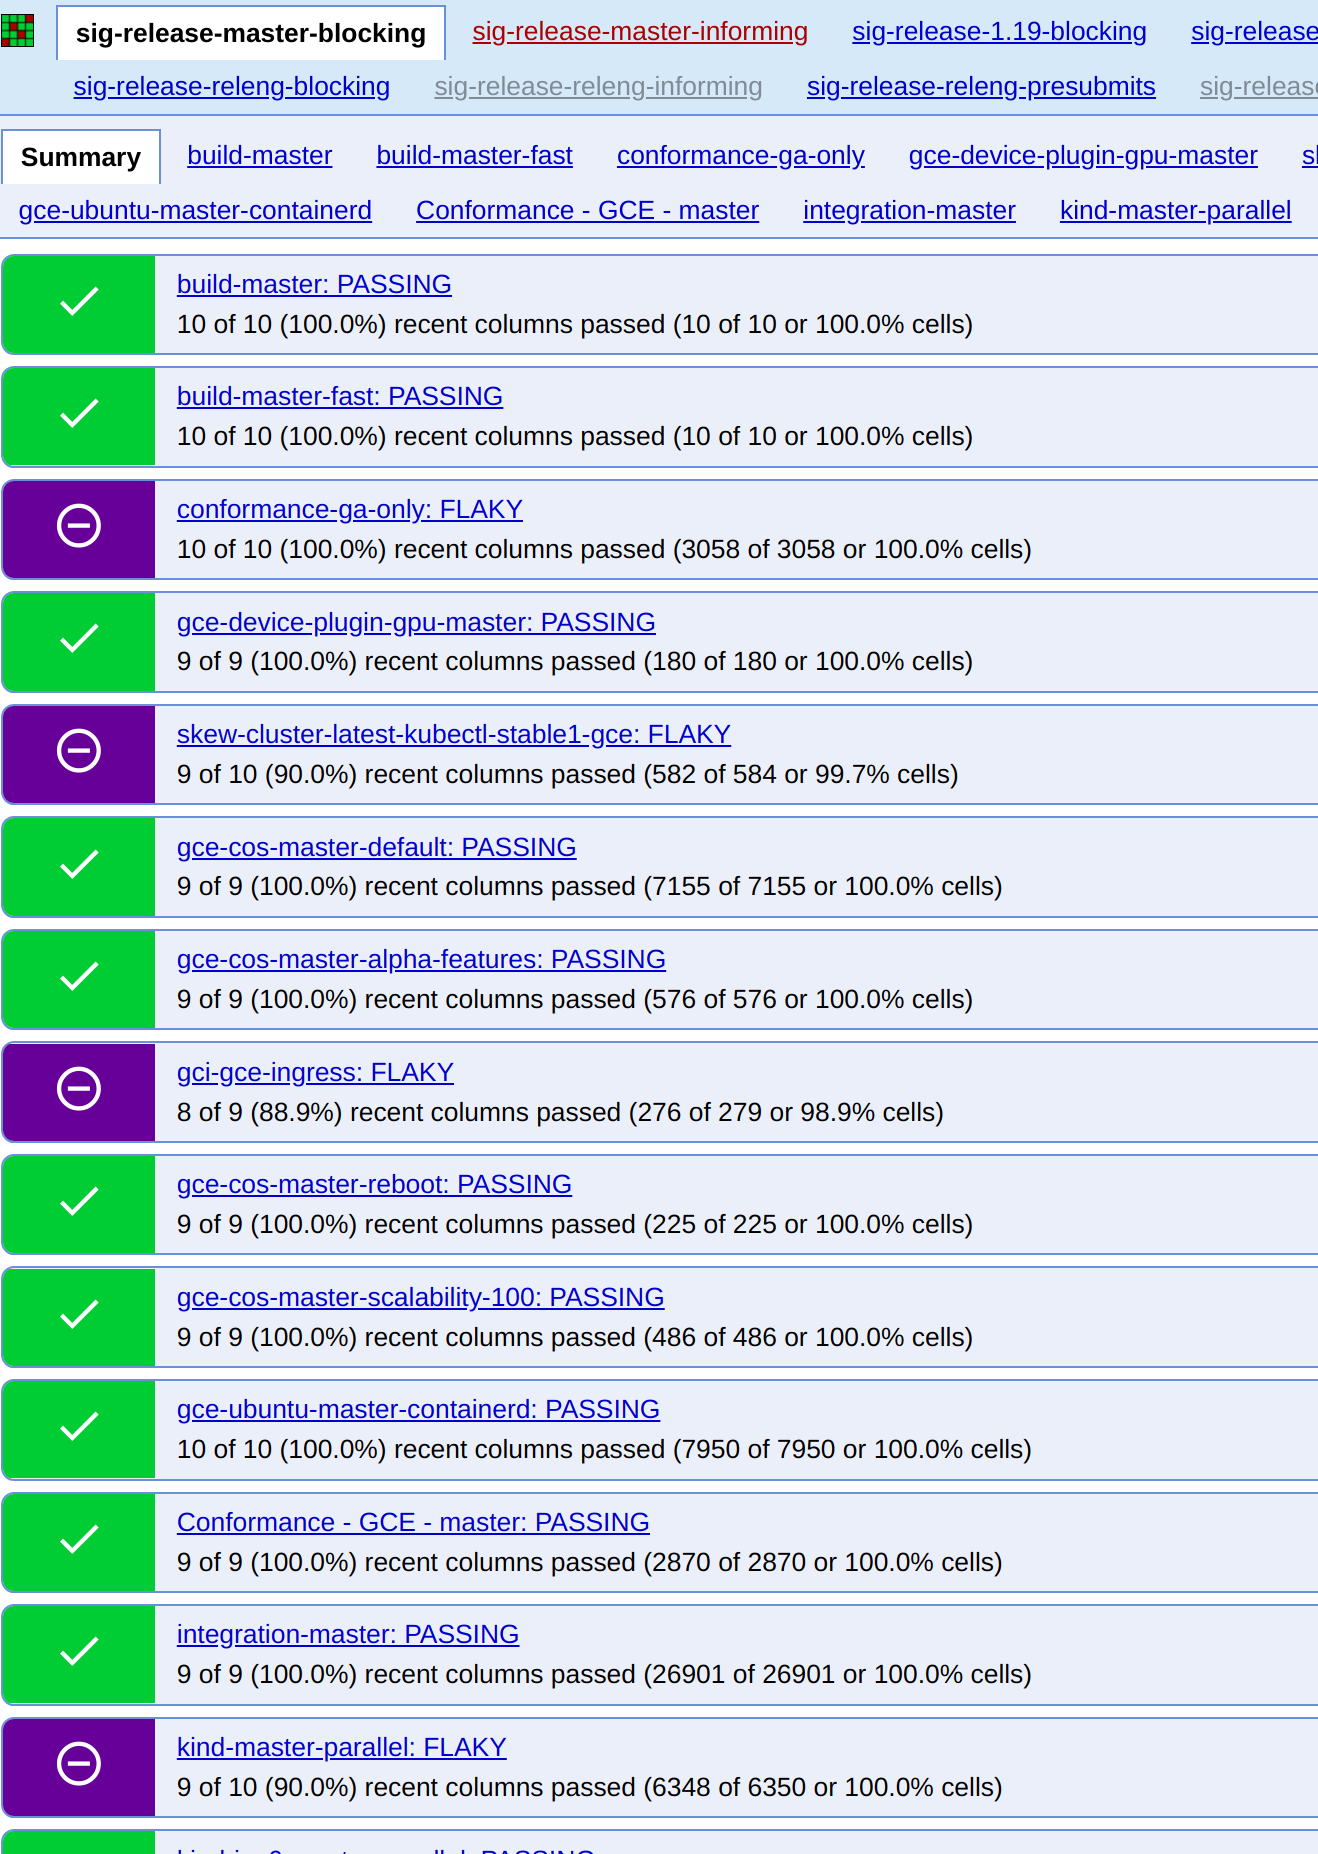
However, if you are viewing the summary page of a Testgrid dashboard alerts are only of secondary interest as the current status of the jobs that are part of the dashboard are displayed more prominently as follows :
- Passing jobs look like this

- Flaky jobs like this

- Failing job with alert shown

Taken from sig-release-master-blocking
Note the metadata on the right hand side showing job run times, the commit id of the last green (passing) job run and the time at which the summary page was loaded (refreshing the browser updates the browser and the update time)
Communicate your findings
The number one thing to do is to communicate your findings: a test or job has been flaking or failing. If you saw a TestGrid alert on a mailing list, please reply to the thread and mention that you are looking into it.
First, check GitHub to see if an issue has already been logged by checking the following:
- Issues logged as Flaky Tests - not triaged
- Issues logged as Flaky Tests - triaged
- CI Signal Board flaky tests issues segmented by problem resolution workflow.
If an issue has already been opened for the test, you can add any new findings that are not already documented in the issue.
For example, if a test is flaking intermittently and you have found another incident where the test has failed that has not been recorded in the issue, then add the new information to the existing issue.
You can:
- Add a link to the Prow job where the latest test failure has occurred, and
- Note the error message
New evidence is especially useful if the root cause of the problem with the test has not yet been determined and the issue still has a needs-triage label.
If the issue has not already been logged, please create a new issue in the kubernetes/kubernetes repo, and choose the appropriate issue template.
You can jump to create either test issue type using the following links :
Filling out an issue
Both test issue templates are reasonably self-explanatory, what follows are guidelines and tips on filling out the templates.
When logging a Flaking or Failing test please:
- use plain text when referring to test names and job names. Inconsistent formatting of names makes it harder to process issues via automation.
- keep an eye out for test names that contain markdown parse-able formatting.
If you are a test maintainer, refrain from including markdown in strings that are used to name your tests and test components.
Fill out the issue for a Flaking Test
1 Which jobs are flaking
The example below was taken from the SIG Release dashboard:
We can see that the following jobs were flaky at the time this screenshot was taken:
- Which tests are flaking
Let's grab an example from the SIG release dashboards and look at the
node-kubelet-master job in sig-release-master node-kubelet-master.

Here we see that at 07.19 IST the tests
E2eNode Suite.[sig-node] Summary API [NodeConformance] when querying /stats/summary should report resource usage through the stats api [cos-stable2]
kubetest.Node Tests [runner]
Failed for Kubernetes commit d8f9e4587
The corresponding test-infra commit was fe9c22dc8
- Since when has it been flaking
You can get the start time of a flake from the header of the TestGrid page showing you all the tests. The red numbers in the screen shot above annotate the grid headings.
They are:
- 1 This row has the times each Prow job was started, each column on the grid represents a single run of the Prow job
- 2 This row is the Prow job run id number
- 3 This is the kubernetes/kubernetes commit id that was tested
- 4 Theses are the kubernetes/test-infra commit ids that were used to build and run the Prow Job; kubernetes/test-infra contains CI job definition yaml, builds for container images used in CI on the Kubernetes project, and also code that implements a lot of the components used to deliver CI, such as Prow, SpyGlass and other components.
Click on a cell in the grid to take you to SpyGlass which displays the Prow job results.
You can also find this data in Triage (see below).
- Reason for failure
Logging an issue brings the flake or failure to the attention of the wider community, as the issue reporter you do not have to find the reason for failure right away (nor the solution). You can just log the error reported by the test when the job was run.
Click on the failed runs (the red cells in the grid) to see the results in SpyGlass.
For node-kubelet-master, we see the following:

Here we see that 2 tests failed (both related to the node problem detector) and
the e2e.go: Node Tests stage was marked as failed (because the node problem
detector tests failed).
You will often see "stages" (steps in an e2e job) as mixed with the tests themselves. The stages tell you what was going on in the e2e job when an error occurred.
If we click on the first test error, we will see logs that will (hopefully) help
us figure out why the test failed.

Further down the page you will see all the logs for the entire test run. Please copy any information you think may be useful from here into the issue.
You can reference a specific line in the logs by click on the line number and then copying the URL which will now include an anchor to the specific line.
- Anything else we need to know
It is important to review the behavior of the flaking test across a range of jobs using Triage.
We can use the Triage tool to see if a test we see failing in a given job has been failing in others and to understand how jobs are behaving.
For example, we can see how the job we have been looking at has been behaving recently.
One important detail is that the job names you see on tabs in TestGrid are often aliases. Job definition details including the job name, the job definition configuration file and a description of the job can be found below the tab name in TestGrid with a URL pointing to the yaml file where the job is configured.
For example, when we clicked on a test run for node-kubelet-master,
the job name, ci-kubernetes-node-kubelet-features, can be found at the top left
corner of the Spyglass page (notice the "ci-kubernetes-" prefix).
Then we can run a query on Triage using ci-kubernetes-node-kubelet-features in the job field Note that the Triage query can be bookmarked and can be used as a deep link that can be added to GitHub issues to assist test maintainers in understanding what is wrong with a test.
At the time of this writing we saw the following:

Note: notice that you can also improve your query by filtering or excluding results based on test name or failure text.
Sometimes, Triage will help you find patterns to figure out the root cause of the problem. In this instance, we can also see that this job has been failing about 2 times per hour.
Iterate
Once you have filled out the issue, please mention it in the appropriate mailing list thread (if you see an email from TestGrid mentioning a job or test failure) and share it with the appropriate SIG in the Kubernetes Slack.
Don't worry if you are not sure how to debug further or how to resolve the issue! All issues are unique and require a bit of experience to figure out how to work on them. For the time being, reach out to people in Slack or the mailing list.