193 lines
5.7 KiB
Markdown
193 lines
5.7 KiB
Markdown
# Getting Started with Jaeger
|
|
|
|
<details>
|
|
<summary>Table of Contents</summary>
|
|
|
|
* [Export traces from the application](#export-traces-from-the-application)
|
|
* [Check results in the console](#check-results-in-the-console)
|
|
* [Collect and visualize traces using Jaeger](#collect-and-visualize-traces-using-jaeger)
|
|
* [Final cleanup](#final-cleanup)
|
|
* [Learn more](#learn-more)
|
|
|
|
</details>
|
|
|
|
## Export traces from the application
|
|
|
|
It is highly recommended to go over the [getting started in 5 minutes - ASP.NET
|
|
Core Application](../getting-started-aspnetcore/README.md) guide or the [getting
|
|
started in 5 minutes - Console
|
|
Application](../getting-started-console/README.md) guide before following along
|
|
this document.
|
|
|
|
Create a new console application and run it:
|
|
|
|
```sh
|
|
dotnet new console --output getting-started-jaeger
|
|
cd getting-started-jaeger
|
|
dotnet run
|
|
```
|
|
|
|
Add reference to [Console
|
|
Exporter](../../../src/OpenTelemetry.Exporter.Console/README.md), [OTLP
|
|
Exporter](../../../src/OpenTelemetry.Exporter.OpenTelemetryProtocol/README.md) and
|
|
[HttpClient Instrumentation](https://github.com/open-telemetry/opentelemetry-dotnet-contrib/tree/main/src/OpenTelemetry.Instrumentation.Http/README.md):
|
|
|
|
```sh
|
|
dotnet add package OpenTelemetry.Exporter.Console
|
|
dotnet add package OpenTelemetry.Exporter.OpenTelemetryProtocol
|
|
dotnet add package OpenTelemetry.Instrumentation.Http
|
|
```
|
|
|
|
Now copy the code from [Program.cs](./Program.cs).
|
|
|
|
### Check results in the console
|
|
|
|
Run the application again and we should see the trace output from the console:
|
|
|
|
```text
|
|
> dotnet run
|
|
|
|
Activity.TraceId: 693f1d15634bfe6ba3254d6f9d20df27
|
|
Activity.SpanId: 429cc5a90a753fb3
|
|
Activity.TraceFlags: Recorded
|
|
Activity.ParentSpanId: 0d64498b736c9a11
|
|
Activity.ActivitySourceName: System.Net.Http
|
|
Activity.DisplayName: GET
|
|
Activity.Kind: Client
|
|
Activity.StartTime: 2024-07-04T13:18:12.2408786Z
|
|
Activity.Duration: 00:00:02.1028562
|
|
Activity.Tags:
|
|
http.request.method: GET
|
|
server.address: httpstat.us
|
|
server.port: 443
|
|
url.full: https://httpstat.us/200?sleep=Redacted
|
|
network.protocol.version: 1.1
|
|
http.response.status_code: 200
|
|
Resource associated with Activity:
|
|
service.name: DemoApp
|
|
service.version: 1.0.0
|
|
service.instance.id: 03ccafab-e9a7-440a-a9cd-9a0163e0d06c
|
|
telemetry.sdk.name: opentelemetry
|
|
telemetry.sdk.language: dotnet
|
|
telemetry.sdk.version: 1.9.0
|
|
...
|
|
```
|
|
|
|
Note that we have configured two exporters in the code:
|
|
|
|
```csharp
|
|
using var tracerProvider = Sdk.CreateTracerProviderBuilder()
|
|
...
|
|
.AddConsoleExporter()
|
|
.AddOtlpExporter()
|
|
.Build();
|
|
```
|
|
|
|
When we ran the application, the `ConsoleExporter` was printing the traces on
|
|
console, and the `OtlpExporter` was attempting to send the traces to Jaeger
|
|
Agent via the default endpoint `http://localhost:4317`.
|
|
|
|
Since we didn't have Jaeger running, the traces received by `OtlpExporter`
|
|
were simply dropped on the floor. In the next step, we are going to learn about
|
|
how to use Jaeger to collect and visualize the traces.
|
|
|
|
```mermaid
|
|
graph LR
|
|
|
|
subgraph SDK
|
|
TracerProvider
|
|
SimpleExportProcessor["SimpleExportProcessor < Activity >"]
|
|
BatchExportProcessor["BatchExportProcessor < Activity >"]
|
|
ConsoleExporter
|
|
OtlpExporter
|
|
end
|
|
|
|
subgraph API
|
|
ActivitySource["ActivitySource(#quot;MyCompany.MyProduct.MyLibrary#quot;)"]
|
|
end
|
|
|
|
ActivitySource --> | System.Diagnostics.Activity | TracerProvider
|
|
|
|
TracerProvider --> | System.Diagnostics.Activity | SimpleExportProcessor --> | Batch | ConsoleExporter
|
|
|
|
TracerProvider --> | System.Diagnostics.Activity | BatchExportProcessor --> | Batch | OtlpExporter
|
|
```
|
|
|
|
## Collect and visualize traces using Jaeger
|
|
|
|
### Install and run Jaeger
|
|
|
|
Download the [latest binary distribution
|
|
archive](https://www.jaegertracing.io/download/) of Jaeger.
|
|
|
|
After finished downloading, extract it to a local location that's easy to
|
|
access. Run the `jaeger-all-in-one(.exe)` executable:
|
|
|
|
```sh
|
|
./jaeger-all-in-one --collector.otlp.enabled
|
|
```
|
|
|
|
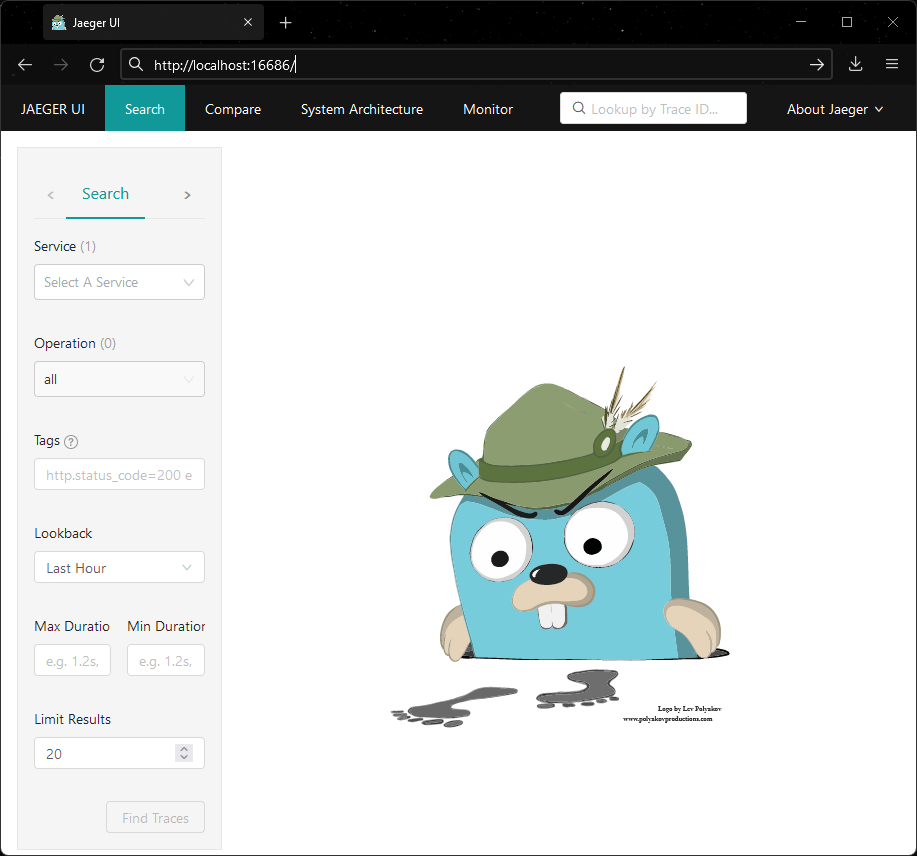
Now we should be able to see the Jaeger UI at
|
|
[http://localhost:16686/](http://localhost:16686/) from a web browser:
|
|
|
|
|
|
|
|
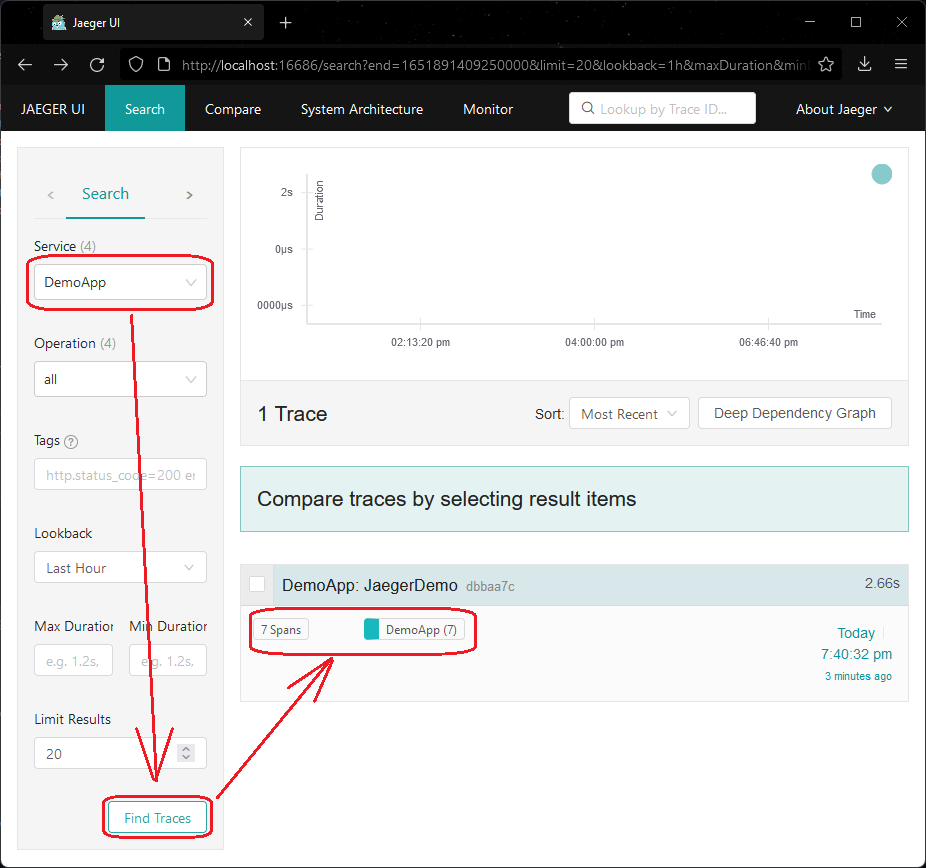
Run the application again and refresh the web page, we should be able to see the
|
|
traces now:
|
|
|
|
|
|
|
|
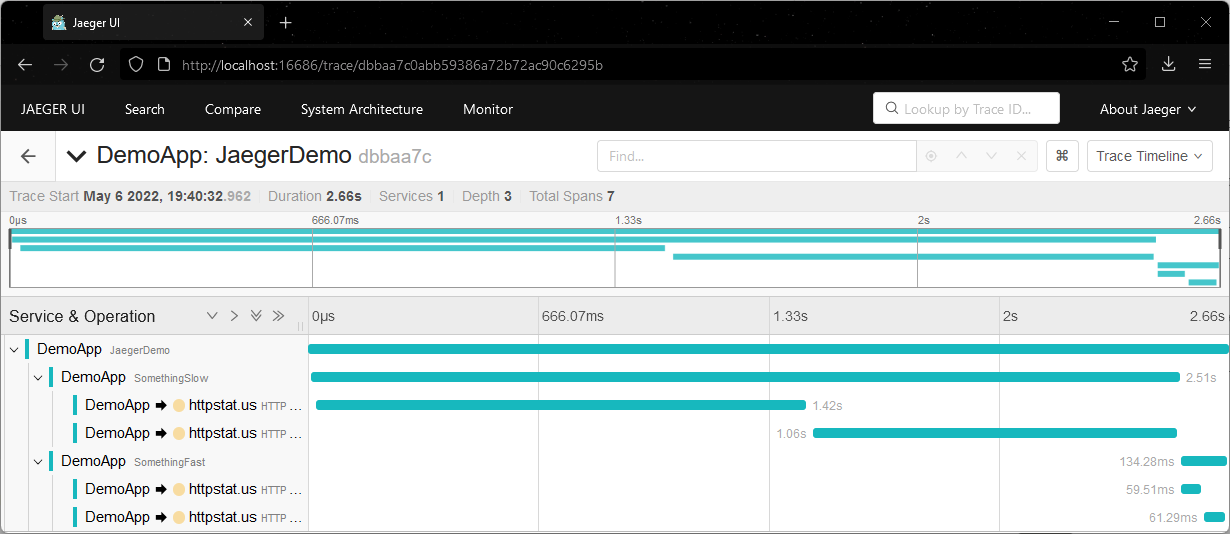
Click on the individual trace to see the [Gantt
|
|
Chart](https://en.wikipedia.org/wiki/Gantt_chart):
|
|
|
|
|
|
|
|
```mermaid
|
|
graph TD
|
|
|
|
OtlpExporter["OtlpExporter"] --> |http://localhost:4317| Jaeger
|
|
Jaeger -->|http://localhost:16686/| JaegerUI["Browser<br/>(Jaeger UI)"]
|
|
```
|
|
|
|
## Final cleanup
|
|
|
|
In the end, remove the Console Exporter so we only have OTLP Exporter in the
|
|
final application:
|
|
|
|
```csharp
|
|
using var tracerProvider = Sdk.CreateTracerProviderBuilder()
|
|
...
|
|
// Remove Console Exporter from the final application
|
|
// .AddConsoleExporter()
|
|
.AddOtlpExporter()
|
|
.Build();
|
|
```
|
|
|
|
```sh
|
|
dotnet remove package OpenTelemetry.Exporter.Console
|
|
```
|
|
|
|
```mermaid
|
|
graph LR
|
|
|
|
subgraph SDK
|
|
TracerProvider
|
|
BatchExportProcessor["BatchExportProcessor < Activity >"]
|
|
OtlpExporter
|
|
end
|
|
|
|
subgraph API
|
|
ActivitySource["ActivitySource(#quot;MyCompany.MyProduct.MyLibrary#quot;)"]
|
|
end
|
|
|
|
ActivitySource --> | System.Diagnostics.Activity | TracerProvider --> | System.Diagnostics.Activity | BatchExportProcessor
|
|
|
|
BatchExportProcessor --> | Batch | OtlpExporter
|
|
```
|
|
|
|
## Learn more
|
|
|
|
* [Jaeger Tracing](https://www.jaegertracing.io/)
|
|
* [OTLP Exporter for OpenTelemetry
|
|
.NET](../../../src/OpenTelemetry.Exporter.OpenTelemetryProtocol/README.md)
|