3.4 KiB
OpenTracing Javaagent
Purpose
The OpenTracing Java Agent contribution is designed to inject code directly to the JVM.
It provides to developers a way to instrument their code, without modifying it.
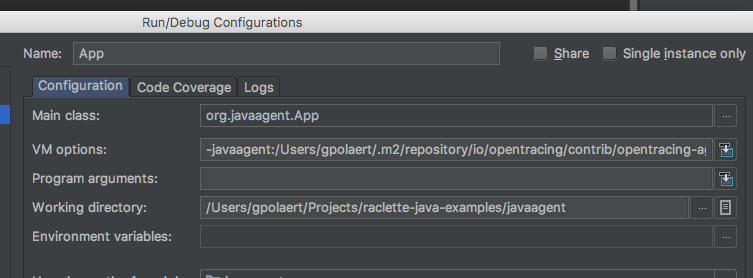
The Java Agent is a compiled Jar and it is added to the JVM using the -javaagent option.
This contribution uses the Byteman project. The contribution provides
a set of rules for instrumenting the code through a collection of otarules.btm files
The contrib is basically able to serve 2 goals:
- Instrumenting custom or legacy code without modifying it (extremely verbose and painful)
- Inject the others OpenTracing contribution in your app (Spring Boot, JDBC wrapper, Jax-Rs, etc. ) and configure them on-fly.
Run the demo
- Check prerequisites here
- Run the application from your IDE using
-javaagent:path/to/opentracing-agent-x.y.z.jar
How it's working
Instrumenting using the existing contributions
The agent is used to load the contrib directly to the existing code. The behavior is
pretty simple: the agent looks for all otarules.otm files in the classpath.
Then, it loads each rule file and the instrumentation starts.
For instrumenting the framework you are using, all you need to do is:
- Provide the corresponding
otarules.btmfile for your framework. Check existing contribution here. - Attach the java agent to the running JVM
- Initialise your tracer
Let's see how to do that:
First add the contrib to the dependencies. You can find them here: https://github.com/opentracing-contrib
    <!-- OpenTracing dependencies -->
    <dependency>
        <groupId>io.opentracing.contrib</groupId>
        <artifactId>opentracing-agent-rules-java-net</artifactId>
        <version>0.0.11</version>
    </dependency>
Datadog provides a way to initialise the tracer using a resolver.
In order to configure it, you just have to edit the dd-trace.yaml file.
defaultServiceName: java-agent-app
writer:
  type: DDAgentWriter
  host: localhost
  port: 8126
sampler:
  type: AllSampler
Then, attach the java agent to the JVM.
java -javaagent:/path/to/opentracing-agent-x.y.z.jar ...
At this time, your code is instrumenting, and you can start to the traces in your APM.
Instrumenting from scratch custom code (advanced users)
If you want to instrument custom code, without using a contribution, you need 2 things:
- A tracer
- A
otarules.btmfile, describing your instrumentation
In this project, we show you an instrumentation. We inject some code via A rule file. The BTM rule files describes when/where/how modify the legacy code. If you want to dig deeper, you have to refer to the official documentation
For instance, here is how to create a new span when the method1 is called somewhere.
Check the full class code.
RULE start method1()
CLASS org.javaagent.App
METHOD method1()
HELPER io.opentracing.contrib.agent.OpenTracingHelper
AT ENTRY
IF TRUE
DO
  activateSpan(getTracer().buildSpan("method1").start());
ENDRULE
You have to add all rules necessary to instrument your code as you want. This is why (almost) nobody uses the agent in that way.
Similarly to the previous example, the tracer is initialised through the yaml config file.