mirror of https://github.com/fluxcd/flagger.git
2.3 KiB
2.3 KiB
Monitoring
Grafana
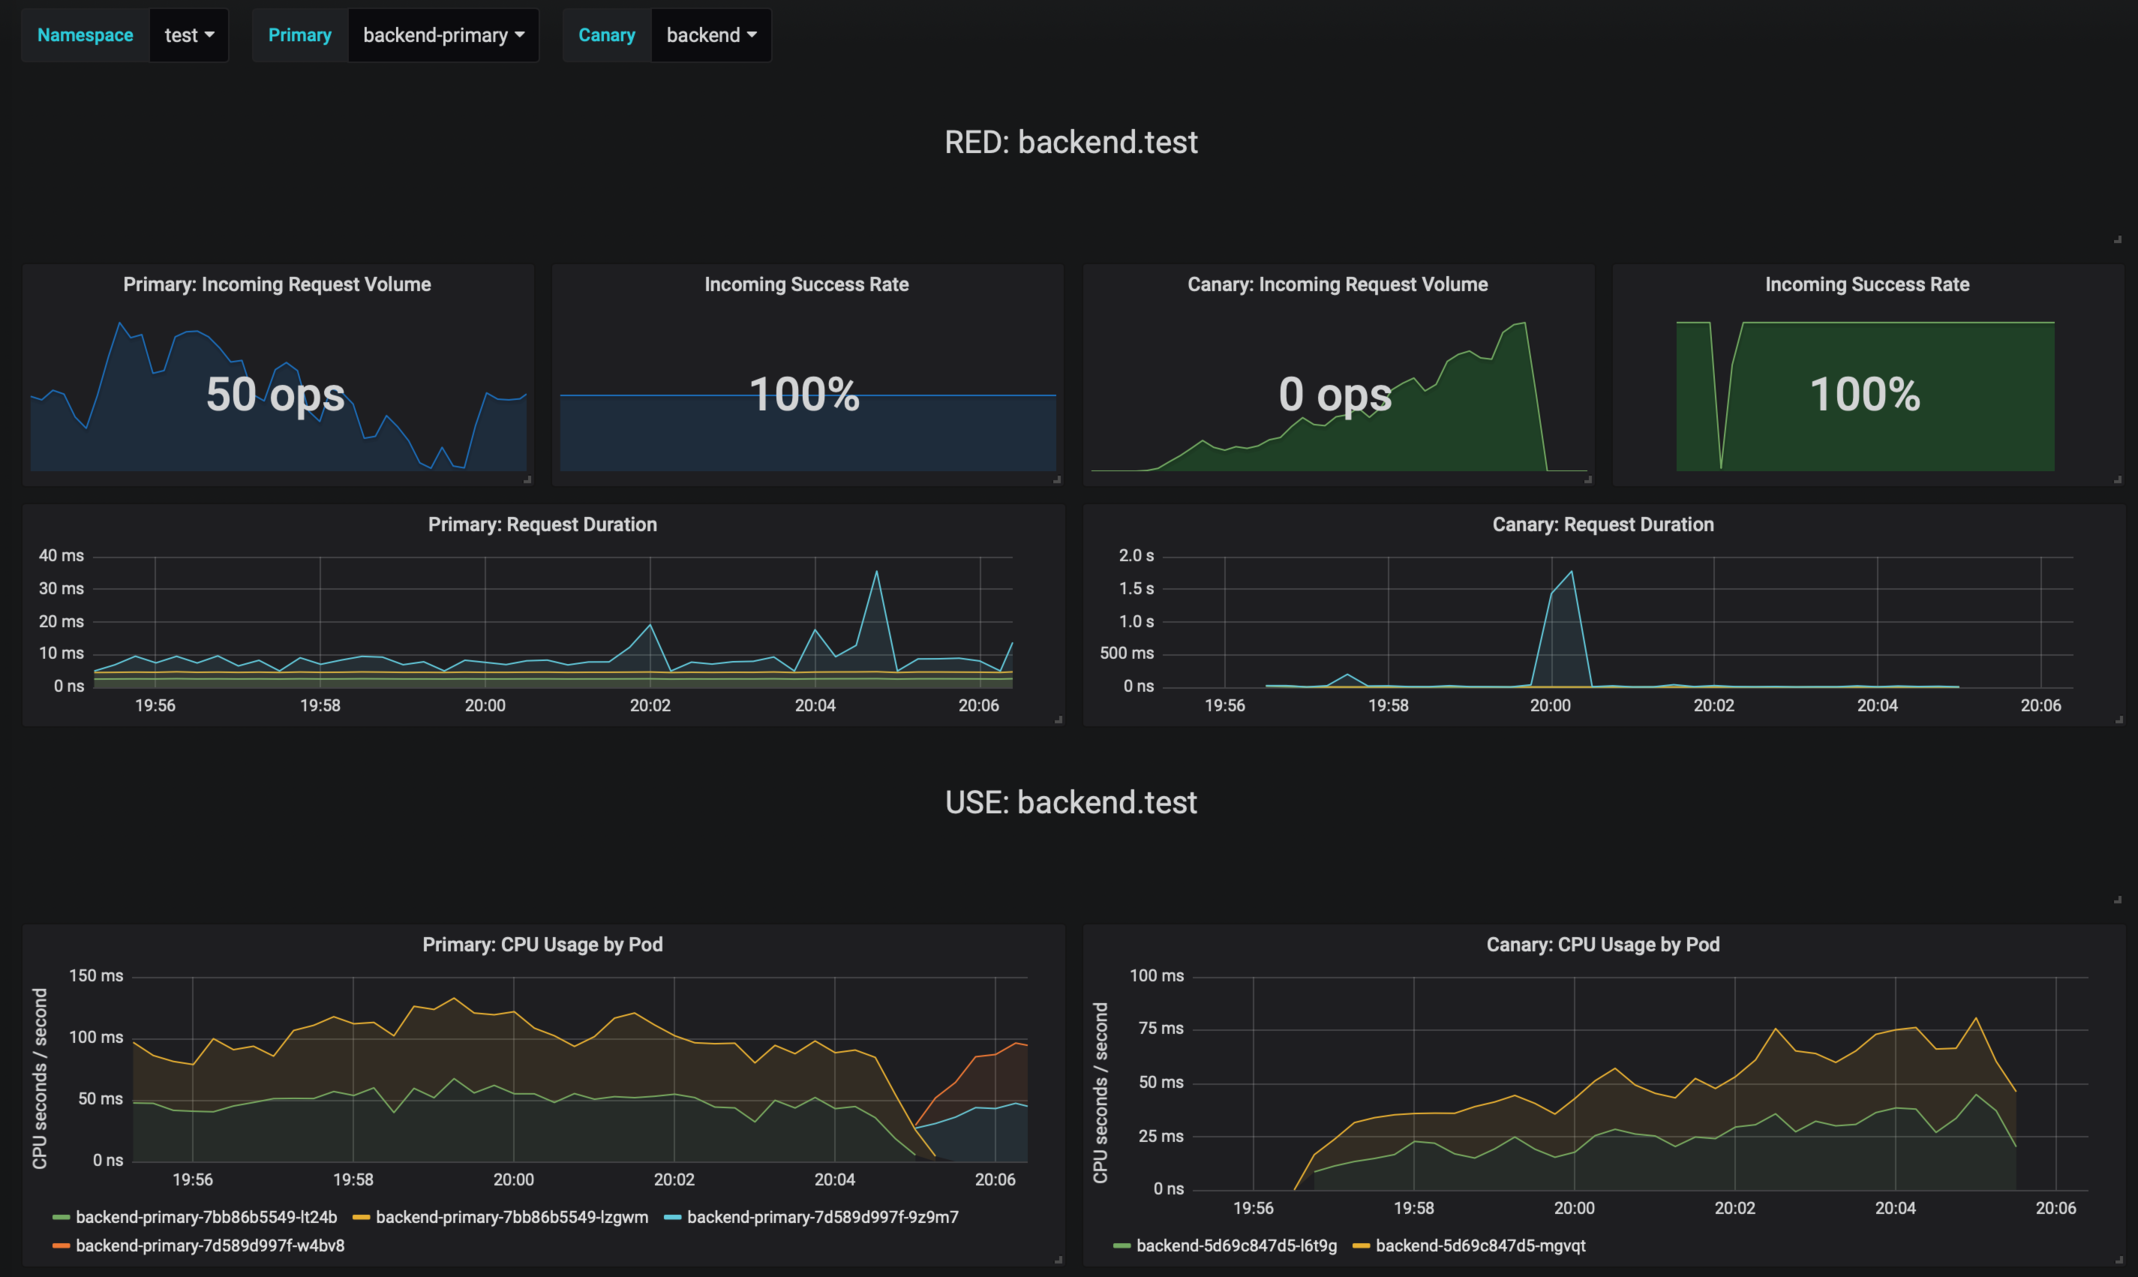
Flagger comes with a Grafana dashboard made for canary analysis. Install Grafana with Helm:
helm upgrade -i flagger-grafana flagger/grafana \
--namespace=istio-system \
--set url=http://prometheus:9090 \
--set user=admin \
--set password=admin
The dashboard shows the RED and USE metrics for the primary and canary workloads:
Logging
The canary errors and latency spikes have been recorded as Kubernetes events and logged by Flagger in json format:
kubectl -n istio-system logs deployment/flagger --tail=100 | jq .msg

Starting canary deployment for podinfo.test
Advance podinfo.test canary weight 5
Advance podinfo.test canary weight 10
Advance podinfo.test canary weight 15
Advance podinfo.test canary weight 20
Advance podinfo.test canary weight 25
Advance podinfo.test canary weight 30
Advance podinfo.test canary weight 35
Halt podinfo.test advancement success rate 98.69% < 99%
Advance podinfo.test canary weight 40
Halt podinfo.test advancement request duration 1.515s > 500ms
Advance podinfo.test canary weight 45
Advance podinfo.test canary weight 50
Copying podinfo.test template spec to podinfo-primary.test
Halt podinfo-primary.test advancement waiting for rollout to finish: 1 old replicas are pending termination
Scaling down podinfo.test
Promotion completed! podinfo.test
Metrics
Flagger exposes Prometheus metrics that can be used to determine the canary analysis status and the destination weight values:
# Canaries total gauge
flagger_canary_total{namespace="test"} 1

# Canary promotion last known status gauge
# 0 - running, 1 - successful, 2 - failed
flagger_canary_status{name="podinfo" namespace="test"} 1

# Canary traffic weight gauge
flagger_canary_weight{workload="podinfo-primary" namespace="test"} 95
flagger_canary_weight{workload="podinfo" namespace="test"} 5

# Seconds spent performing canary analysis histogram
flagger_canary_duration_seconds_bucket{name="podinfo",namespace="test",le="10"} 6
flagger_canary_duration_seconds_bucket{name="podinfo",namespace="test",le="+Inf"} 6
flagger_canary_duration_seconds_sum{name="podinfo",namespace="test"} 17.3561329
flagger_canary_duration_seconds_count{name="podinfo",namespace="test"} 6