mirror of https://github.com/fluxcd/flagger.git
70 lines
2.3 KiB
Markdown
70 lines
2.3 KiB
Markdown
# Monitoring
|
|
|
|
### Grafana
|
|
|
|
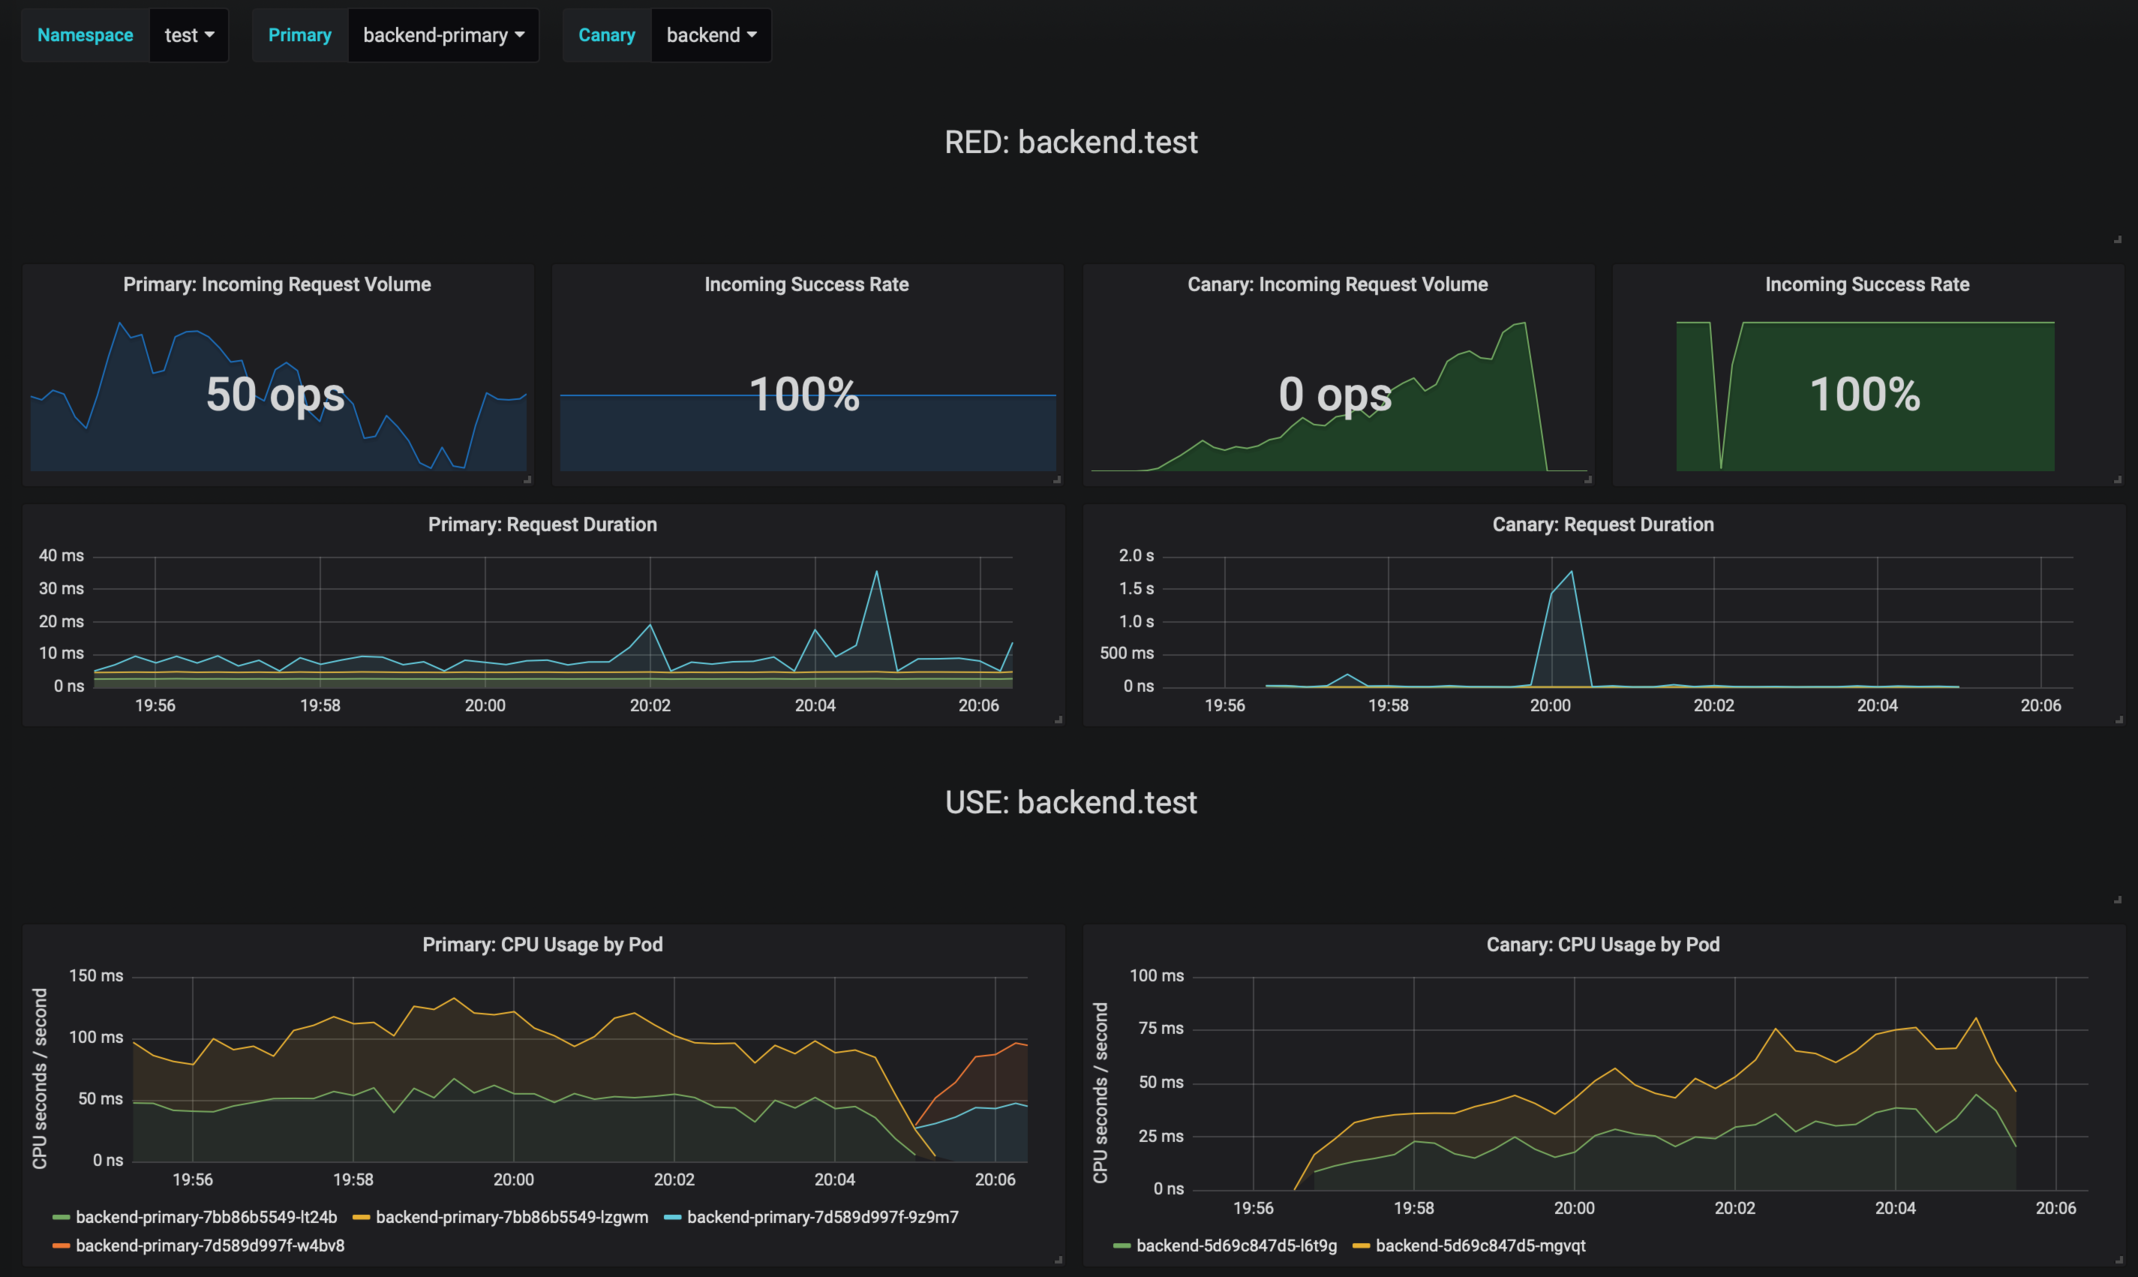
Flagger comes with a Grafana dashboard made for canary analysis. Install Grafana with Helm:
|
|
|
|
```bash
|
|
helm upgrade -i flagger-grafana flagger/grafana \
|
|
--namespace=istio-system \
|
|
--set url=http://prometheus:9090 \
|
|
--set user=admin \
|
|
--set password=admin
|
|
```
|
|
|
|
The dashboard shows the RED and USE metrics for the primary and canary workloads:
|
|
|
|

|
|
|
|
### Logging
|
|
|
|
The canary errors and latency spikes have been recorded as Kubernetes events and logged by Flagger in json format:
|
|
|
|
```text
|
|
kubectl -n istio-system logs deployment/flagger --tail=100 | jq .msg
|
|
|
|
Starting canary deployment for podinfo.test
|
|
Advance podinfo.test canary weight 5
|
|
Advance podinfo.test canary weight 10
|
|
Advance podinfo.test canary weight 15
|
|
Advance podinfo.test canary weight 20
|
|
Advance podinfo.test canary weight 25
|
|
Advance podinfo.test canary weight 30
|
|
Advance podinfo.test canary weight 35
|
|
Halt podinfo.test advancement success rate 98.69% < 99%
|
|
Advance podinfo.test canary weight 40
|
|
Halt podinfo.test advancement request duration 1.515s > 500ms
|
|
Advance podinfo.test canary weight 45
|
|
Advance podinfo.test canary weight 50
|
|
Copying podinfo.test template spec to podinfo-primary.test
|
|
Halt podinfo-primary.test advancement waiting for rollout to finish: 1 old replicas are pending termination
|
|
Scaling down podinfo.test
|
|
Promotion completed! podinfo.test
|
|
```
|
|
|
|
### Metrics
|
|
|
|
Flagger exposes Prometheus metrics that can be used to determine the canary analysis status and
|
|
the destination weight values:
|
|
|
|
```bash
|
|
# Canaries total gauge
|
|
flagger_canary_total{namespace="test"} 1
|
|
|
|
# Canary promotion last known status gauge
|
|
# 0 - running, 1 - successful, 2 - failed
|
|
flagger_canary_status{name="podinfo" namespace="test"} 1
|
|
|
|
# Canary traffic weight gauge
|
|
flagger_canary_weight{workload="podinfo-primary" namespace="test"} 95
|
|
flagger_canary_weight{workload="podinfo" namespace="test"} 5
|
|
|
|
# Seconds spent performing canary analysis histogram
|
|
flagger_canary_duration_seconds_bucket{name="podinfo",namespace="test",le="10"} 6
|
|
flagger_canary_duration_seconds_bucket{name="podinfo",namespace="test",le="+Inf"} 6
|
|
flagger_canary_duration_seconds_sum{name="podinfo",namespace="test"} 17.3561329
|
|
flagger_canary_duration_seconds_count{name="podinfo",namespace="test"} 6
|
|
```
|
|
|
|
|