198 lines
6.7 KiB
Markdown
198 lines
6.7 KiB
Markdown
# Quick start on exporting metrics to Prometheus/Grafana
|
|
|
|
- [Quick start on exporting metrics to Prometheus/Grafana](#quick-start-on-exporting-metrics-to-prometheusgrafana)
|
|
- [Prerequisite](#prerequisite)
|
|
- [Introduction](#introduction)
|
|
- [Configure OpenTelemetry to Expose metrics via Prometheus Endpoint](#configure-opentelemetry-to-expose-metrics-via-prometheus-endpoint)
|
|
- [Check Results in the browser](#check-results-in-the-browser)
|
|
- [Download Prometheus](#download-prometheus)
|
|
- [Prometheus and Grafana](#prometheus-and-grafana)
|
|
- [Configuration](#configuration)
|
|
- [Start Prometheus](#start-prometheus)
|
|
- [View Results in Prometheus](#view-results-in-prometheus)
|
|
- [View/Query Results with Grafana](#viewquery-results-with-grafana)
|
|
|
|
## Prerequisite
|
|
|
|
It is highly recommended to go over the [getting-started](../getting-started/README.md)
|
|
doc before following along this document.
|
|
|
|
## Introduction
|
|
|
|
- [What is Prometheus?](https://prometheus.io/docs/introduction/overview/)
|
|
|
|
- [Grafana support for
|
|
Prometheus](https://prometheus.io/docs/visualization/grafana/#creating-a-prometheus-graph)
|
|
|
|
### Configure OpenTelemetry to Expose metrics via Prometheus Endpoint
|
|
|
|
Create a new console application and run it:
|
|
|
|
```sh
|
|
dotnet new console --output prometheus-http-server
|
|
cd prometheus-http-server
|
|
dotnet run
|
|
```
|
|
|
|
Add a reference to [prometheus
|
|
exporter](https://www.nuget.org/packages/opentelemetry.exporter.prometheus) to
|
|
this application.
|
|
|
|
```shell
|
|
dotnet add package OpenTelemetry.Exporter.Prometheus --version 1.2.0-rc1
|
|
```
|
|
|
|
Now, we are going to make some small tweaks to the example in the
|
|
getting-started metrics `Program.cs` to make the metrics available via
|
|
OpenTelemetry Prometheus Exporter.
|
|
|
|
First, copy and paste everything from getting-started
|
|
metrics [example](../getting-started/Program.cs) to the Program.cs file of the
|
|
new console application (prometheus-http-server) we've created.
|
|
|
|
And replace the below line:
|
|
|
|
```csharp
|
|
.AddConsoleExporter()
|
|
```
|
|
|
|
with
|
|
|
|
```csharp
|
|
.AddPrometheusExporter(opt =>
|
|
{
|
|
opt.StartHttpListener = true;
|
|
opt.HttpListenerPrefixes = new string[] { $"http://localhost:9184/" };
|
|
})
|
|
```
|
|
|
|
With `.AddPrometheusExporter()` function, OpenTelemetry `PrometheusExporter` will
|
|
export data via the endpoint defined by `HttpListenerPrefixes`.
|
|
|
|
Also, for our learning purpose, use a while-loop to keep increasing the counter
|
|
value until any key is pressed.
|
|
|
|
```csharp
|
|
Console.WriteLine("Press any key to exit");
|
|
while (!Console.KeyAvailable)
|
|
{
|
|
Thread.Sleep(1000);
|
|
MyFruitCounter.Add(1, new("name", "apple"), new("color", "red"));
|
|
MyFruitCounter.Add(2, new("name", "lemon"), new("color", "yellow"));
|
|
MyFruitCounter.Add(1, new("name", "lemon"), new("color", "yellow"));
|
|
...
|
|
...
|
|
...
|
|
}
|
|
```
|
|
|
|
After the above modifications, now our `Program.cs` should look like [this](./Program.cs).
|
|
|
|
### Check Results in the browser
|
|
|
|
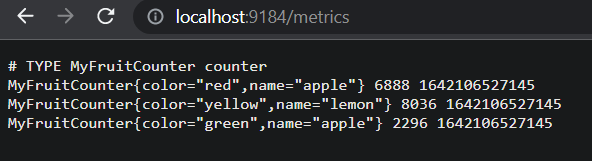
Start the application and leave the process running. Now we should be able to
|
|
see the metrics at the endpoint we've defined in `Program.cs`; in this case, the
|
|
endpoint is: "http://localhost:9184/".
|
|
|
|
Check the output metrics with your favorite browser:
|
|
|
|
|
|
|
|
Now, we understand how we can configure Opentelemetry `PrometheusExporter` to
|
|
export metrics the endpoint we specified. Next, we are going to learn about how
|
|
to use Prometheus and Grafana to view/query the metrics
|
|
visualization.
|
|
|
|
## Download Prometheus
|
|
|
|
Follow the [first steps]((https://prometheus.io/docs/introduction/first_steps/))
|
|
to download the [latest release](https://prometheus.io/download/) of Prometheus.
|
|
|
|
## Prometheus and Grafana
|
|
|
|
### Configuration
|
|
|
|
After finished downloading, extract it to a local location that's easy to
|
|
access. We will find the default Prometheus configuration YAML file in the
|
|
folder, named `prometheus.yml`.
|
|
|
|
Let's create a new file in the same location as where `prometheus.yml` locates,
|
|
and named the new file as `otel.yml` for this exercise. Then, copy and paste the
|
|
entire content below into the otel.yml file we have created just now.
|
|
|
|
```yaml
|
|
global:
|
|
scrape_interval: 10s
|
|
scrape_timeout: 10s
|
|
evaluation_interval: 10s
|
|
scrape_configs:
|
|
- job_name: MyOpenTelemetryDemo
|
|
honor_timestamps: true
|
|
scrape_interval: 1s
|
|
scrape_timeout: 1s
|
|
metrics_path: /metrics
|
|
scheme: http
|
|
follow_redirects: true
|
|
static_configs:
|
|
- targets:
|
|
# set the target to the location where metrics will be exposed by
|
|
# the OpenTelemetry Prometheus Exporter
|
|
- localhost:9184
|
|
```
|
|
|
|
### Start Prometheus
|
|
|
|
Follow the instructions from
|
|
[starting-prometheus](https://prometheus.io/docs/introduction/first_steps/#starting-prometheus)
|
|
to start the Prometheus server and verify it has been started successfully.
|
|
|
|
Please note that we will need pass in otel.yml file as the argument:
|
|
|
|
```console
|
|
./prometheus --config.file=otel.yml
|
|
```
|
|
|
|
### View Results in Prometheus
|
|
|
|
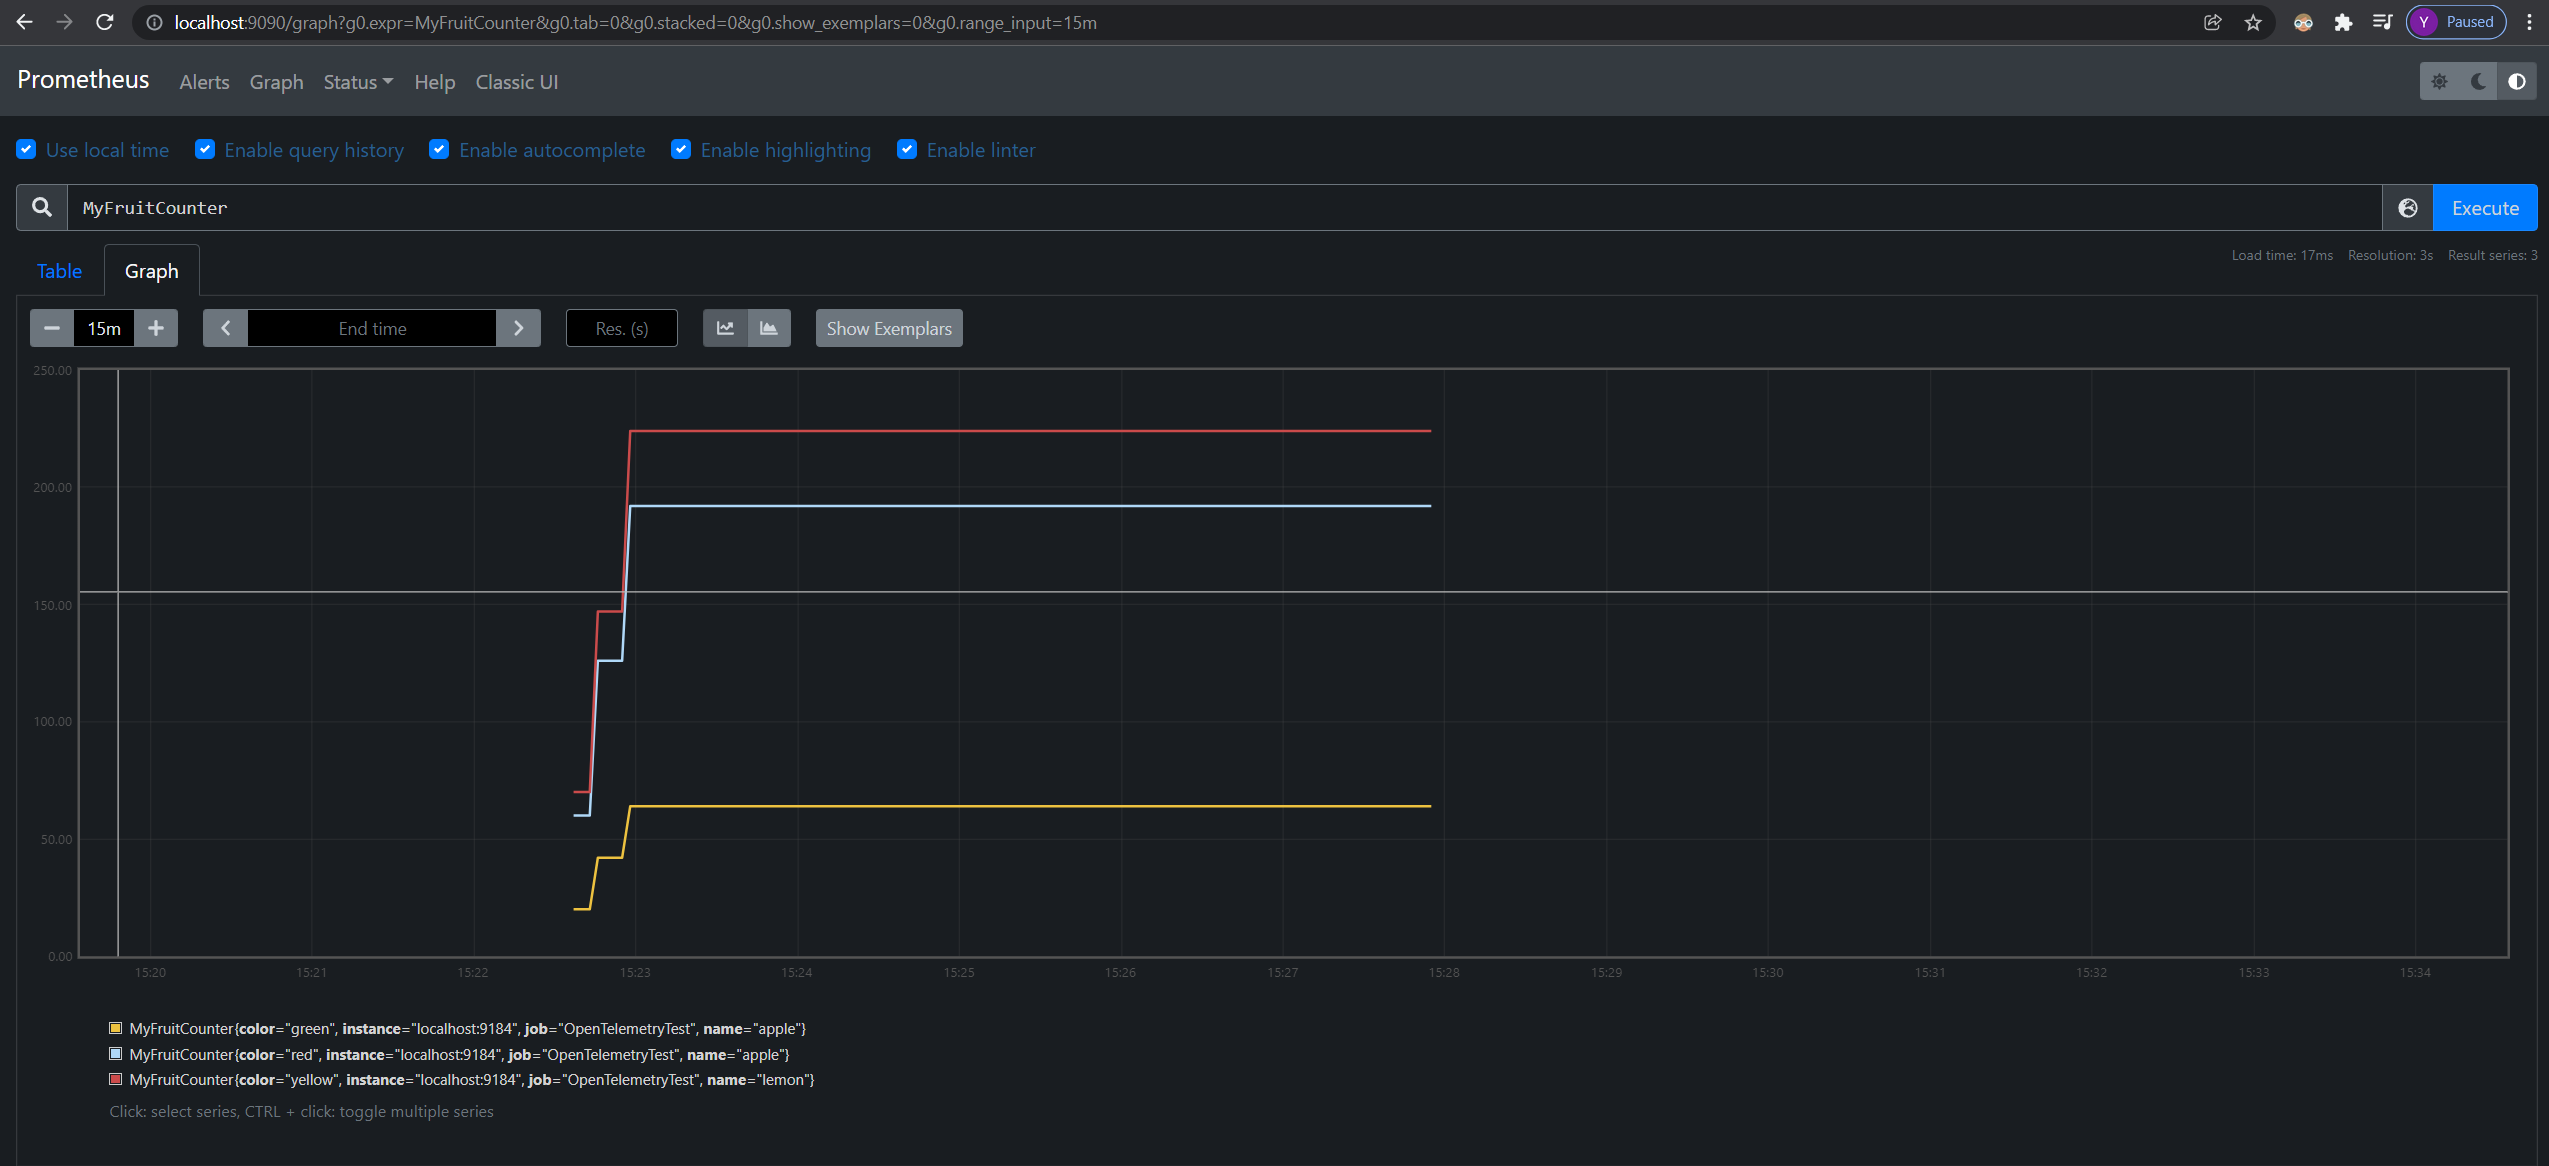
To use the graphical interface for viewing our metrics with Prometheus, navigate
|
|
to "http://localhost:9090/graph", and type `MyFruitCounter` in the expression
|
|
bar of the UI; finally, click the execute button.
|
|
|
|
We should be able to see the following chart from the browser:
|
|
|
|
|
|
|
|
From the legend, we can see that the `instance` name and the `job` name are the
|
|
values we have set in `otel.yml`.
|
|
|
|
Congratulations!
|
|
|
|
Now we know how to configure Prometheus server and deploy OpenTelemetry
|
|
`PrometheusExporter` to export our metrics. Next, we are going to explore a tool
|
|
called Grafana, which has powerful visualizations for the metrics.
|
|
|
|
### View/Query Results with Grafana
|
|
|
|
Please [Install Grafana](https://grafana.com/docs/grafana/latest/installation/).
|
|
|
|
For windows users, after finishing installation, start the standalone Grafana
|
|
server, grafana-server.exe located in the bin folder. Then, use the browser to
|
|
navigate to the default port of Grafana `3000`. We can confirm the port number
|
|
with the logs from the command line after starting the Grafana server as well.
|
|
|
|
Follow the instructions in the Grafana getting started
|
|
[doc](https://grafana.com/docs/grafana/latest/getting-started/getting-started/#step-2-log-in)
|
|
to log in.
|
|
|
|
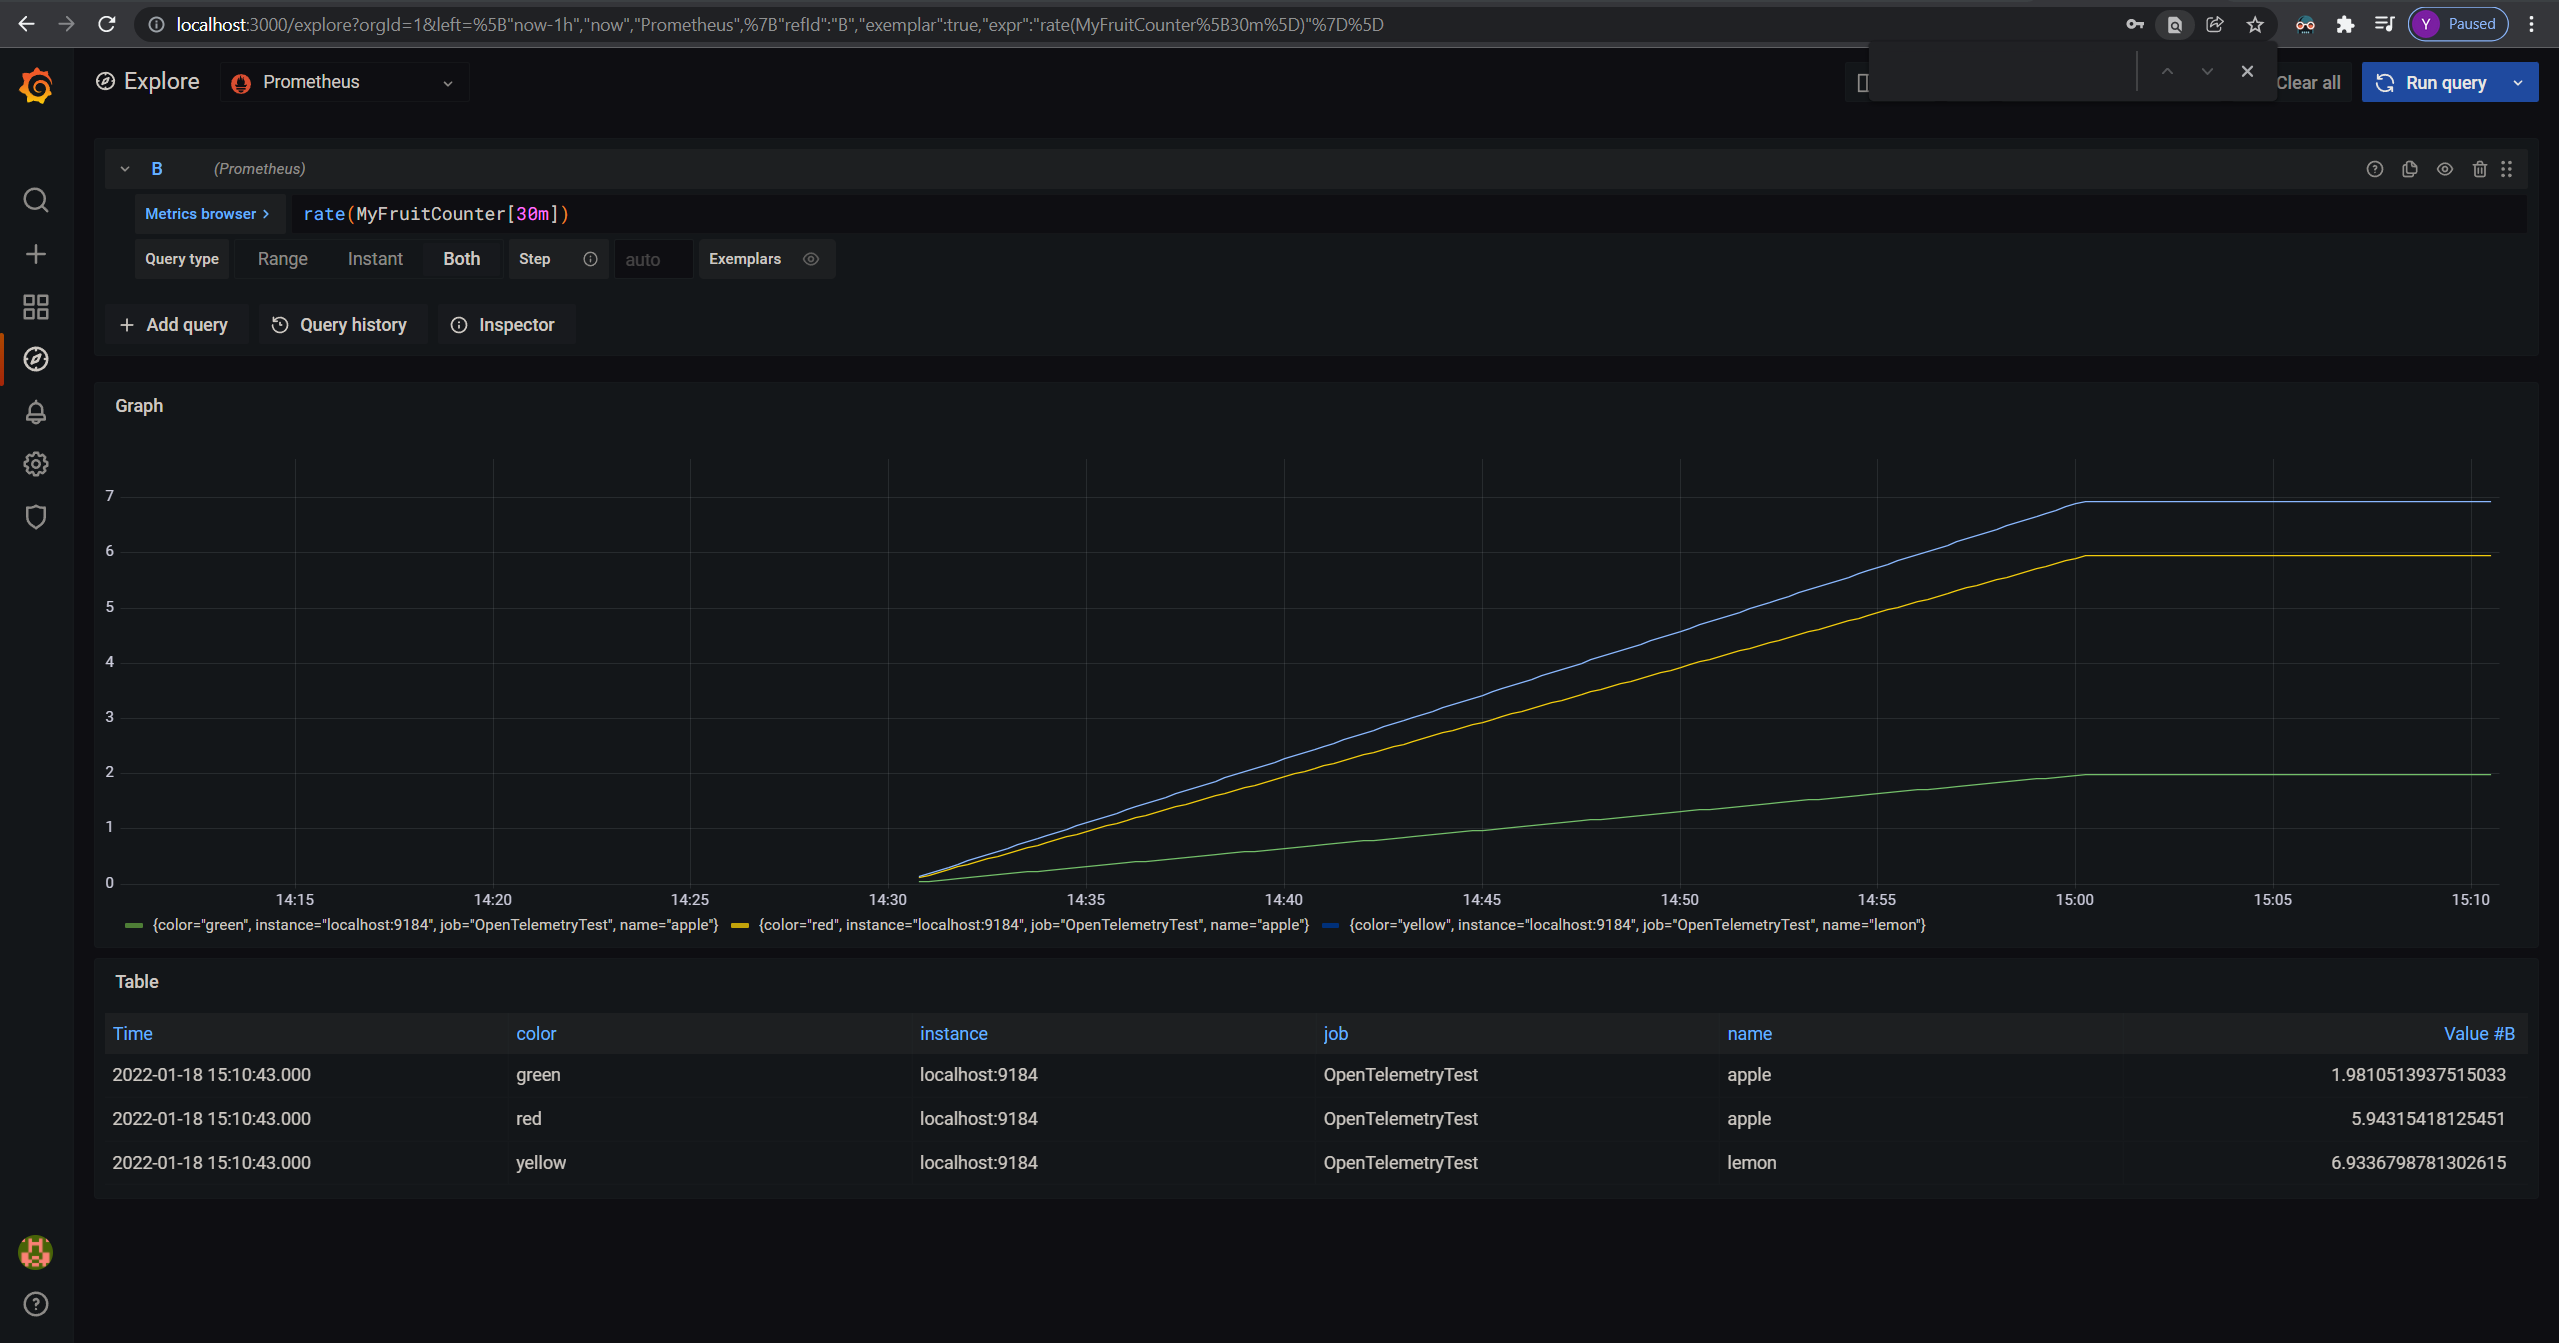
After successfully logging in, click on the explore option on the left panel of
|
|
the website - we should be able to write some queries to explore our metrics
|
|
now!
|
|
|
|
Feel free to find some handy PromQL
|
|
[here](https://promlabs.com/promql-cheat-sheet/).
|
|
|
|
In the below example, the query targets to find out what is the per-second rate
|
|
of increace of myFruitCounter over the last 30 minutes:
|
|
|
|
|